![]()
The Fire Monitoring, Mapping and Modeling System (Fire M3) is an initiative of the Canada Centre for Remote Sensing and the Canadian Forest Service. This demonstd sustainable
development program of Natural Resources Canada.
The multiple award winner, Fire Monitoring, Mapping and Modelling
(Fire M3) project, led by CCRS and Canadian Forestry Service, has been developing an
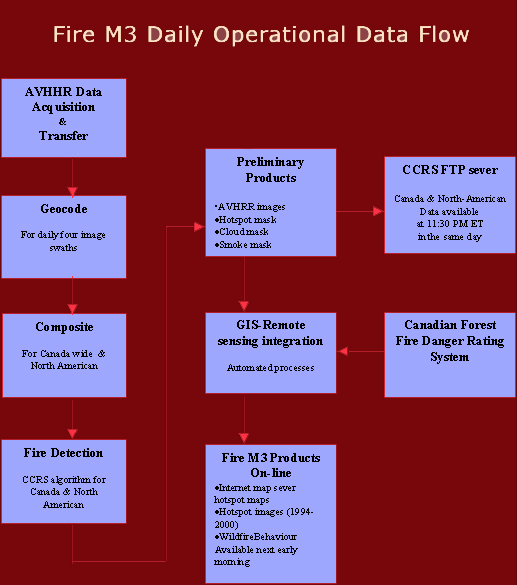
on-line, GIS-based operational system for fire monitoring and mapping with integrated
information of fire behaviour prediction (figure 1). The system began daily operation on
May 1 and ended on October 31.
Automated monitoring and mapping of wildfires
An AVHRR image processing system at CCRS was set up. After acquisition of the imagery at Prince Albert Receiving Station, raw imagery was sent to CCRS server. Geocomp-n calibrates, geocodes, and composites daily AVHRR imagery over Canada.
Then a CCRS fire detection algorithm was applied to AVHRR images
to detect wildfiles. And the image processing system produces Canada-wide TIFF images of
hotspots superimposed on background imagery (figure 2), as well as hotspot mask, smoke
mask, cloud mask. Entail procedure takes 5-6 hours. The preliminary products are uploaded
on CCRS ftp site at 11:30 PM in the same day.
System integration, products and services
An Internet Map Server (IMS) for Fire M3 was established with ArcView at Northern Forestry Centre, Canadian Forestry Service. Automated processes of GIS-remote sensing integration convert the daily fire activity images from CCRS into GIS compatible formats. Meanwhile the samplings of fire weather indexes and fire Behaviour parameters grids (figure 3) from the Canadian Wildland Fire Information System at hotspot locations are processed to produce daily and cumulative forest fire behavior products such as fuel consumption, fire intensity and type of fire (figure 4).
IMS makes images and data available for viewing via the web and allows users for zooming, panning, and querying of maps over the web. A complete set of annotations was assembled for use with the map server, including lakes, rivers, cities, and roads. More detailed coverages are thresholds so that they are only displayed at larger scales.
Fire M3 daily products at IMS include:
- Map of current day's hotspots
- Map of season-to-date hotspots
- Daily hotspot count chart
- Map of current day's hotspots overlaid on the AVHRR image
- Animation of daily hotspot maps
- Archived maps, images and charts
- Fire weather and behavior estimates for each hot spot
All data sets include the historical data for 1994-1999,
season-to-date data for 2000, and the current day data being updated daily.
Experimental products of Fire M3 for North-America
A experimental AVHRR imagery of hotspots (figure 5) and hotspot mask for North-American have been being produced under a NASA project of land cover and land use change research. CCRS fire detection algorithm is tested over US ecosystems.
Figure 6 is an animation of Idaho and Montana wildfire from July 21 through August 30, 2000, which shows the daily fire progression.
Figure 7 is a fire image used for planning fire fighting in Idaho and Montana, which shows active fire and burned area.