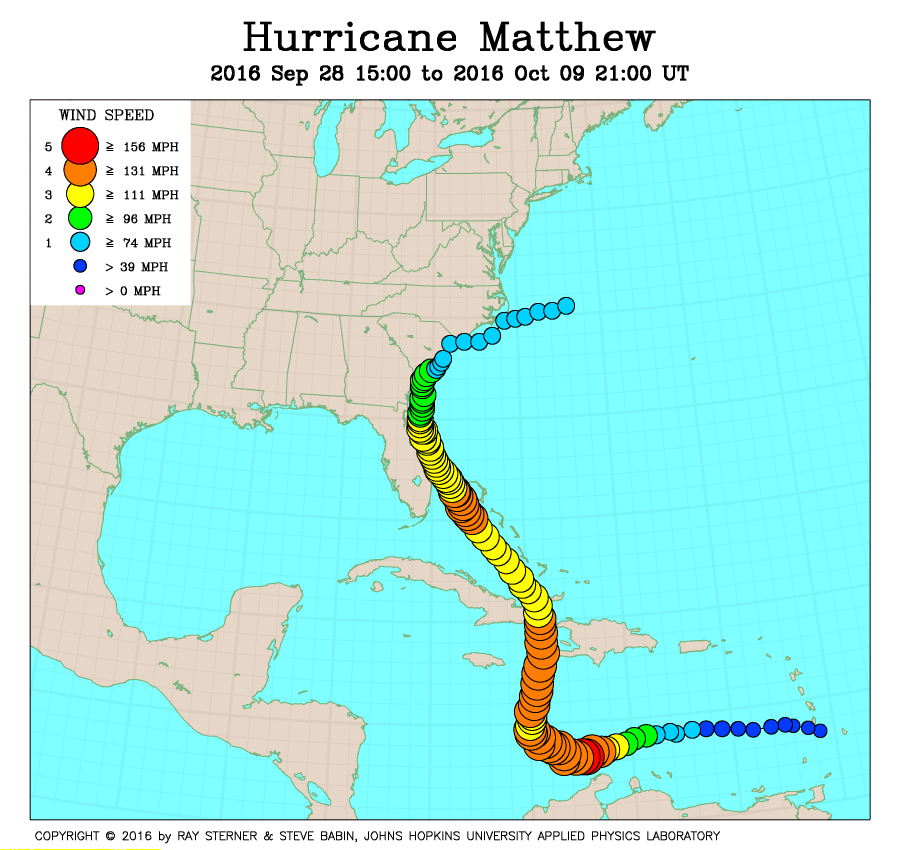
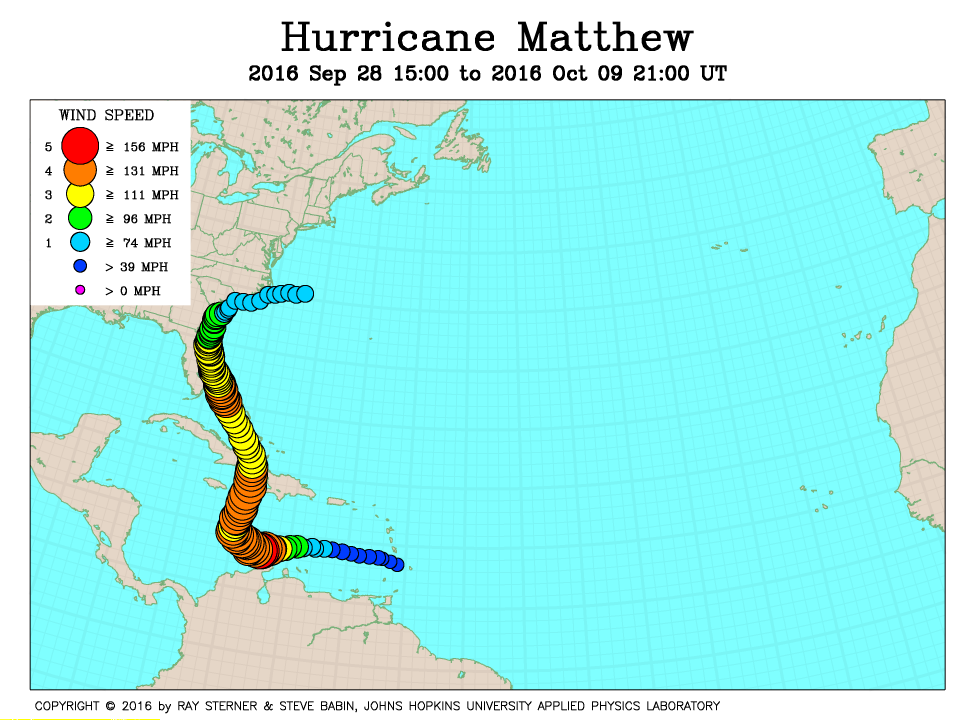
Track maps
Matthew developed from a strong tropical wave in the Windward Islands at the eastern end of the Caribbean Sea.
 Matthew track on SST image of 1 October (248 Kb) This image
represents the average composite sea surface temperature (SST) derived from
NOAA satellite AVHRR data over the 7 days ending 1 October 2016. The
averaging is done to remove clouds. The temperature scale for SST is
24C to 32C. The track of Matthew is overlaid on this image.
Matthew track on SST image of 1 October (248 Kb) This image
represents the average composite sea surface temperature (SST) derived from
NOAA satellite AVHRR data over the 7 days ending 1 October 2016. The
averaging is done to remove clouds. The temperature scale for SST is
24C to 32C. The track of Matthew is overlaid on this image.
Track file
Track data (lat/lon, winds, etc.) in a text file.