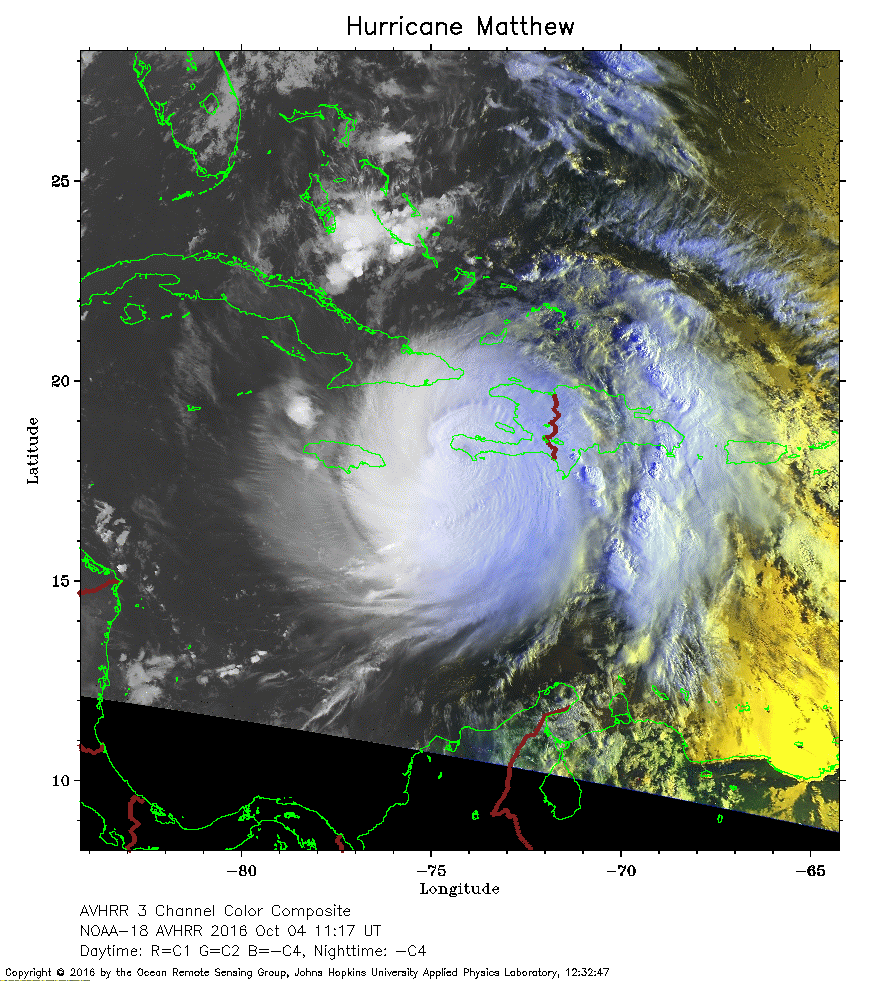
 2016 October 04 11:17 UT
NOAA-18 satellite AVHRR 3 channel color composite daytime image.
A closer view (317 Kb) is seen by clicking on this small image.
The maximum sustained winds are 145 mph.
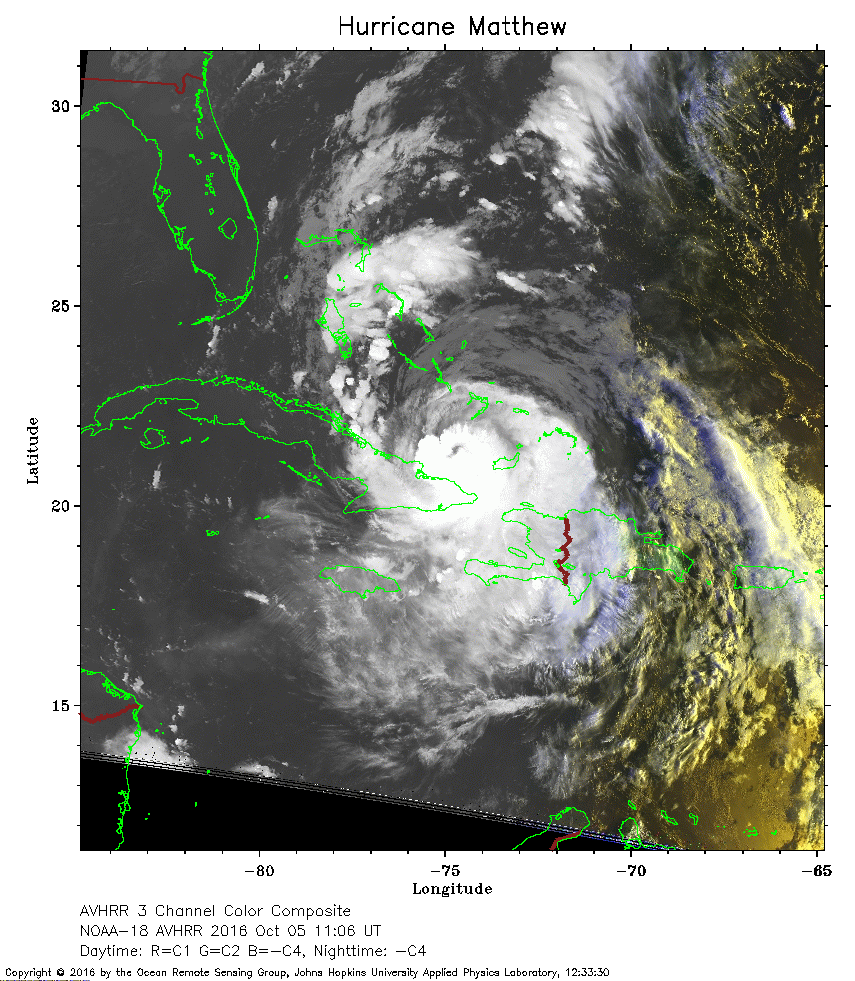 2016 October 05 11:06 UT
NOAA-18 satellite AVHRR 3 channel color composite daytime image.
A closer view (300 Kb) is seen by clicking on this small image.
The maximum sustained winds have decreased to 125 mph.
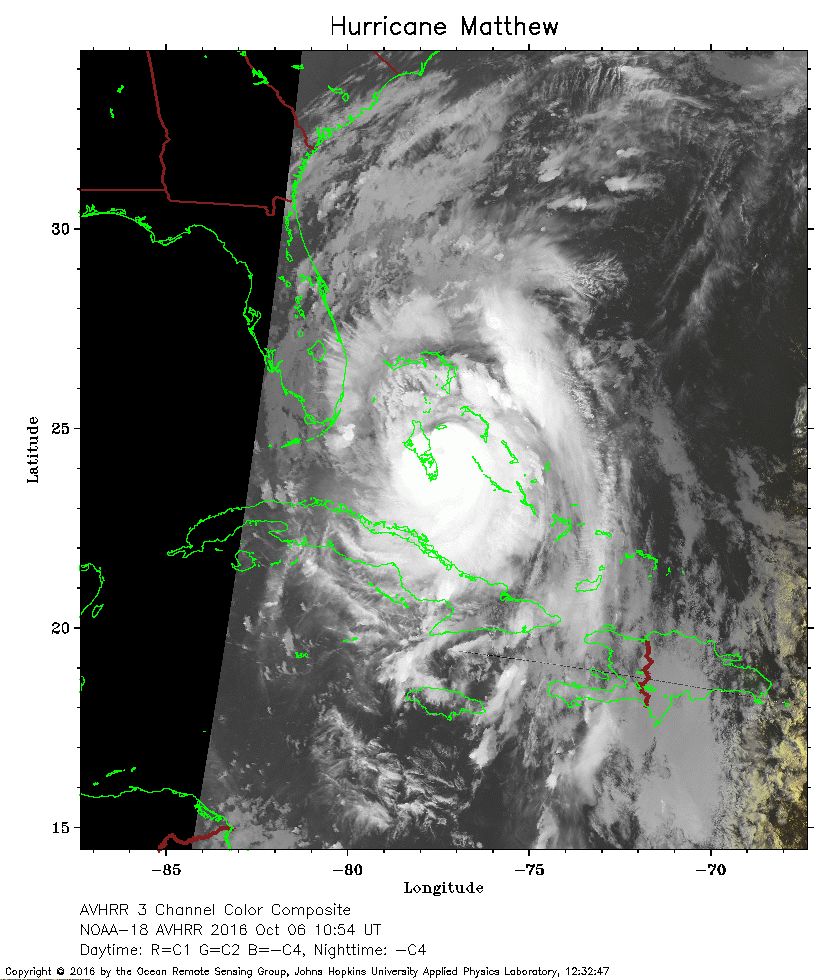 2016 October 06 10:54 UT
NOAA-18 satellite AVHRR 3 channel color composite daytime image.
A closer view (243 Kb) is seen by clicking on this small image.
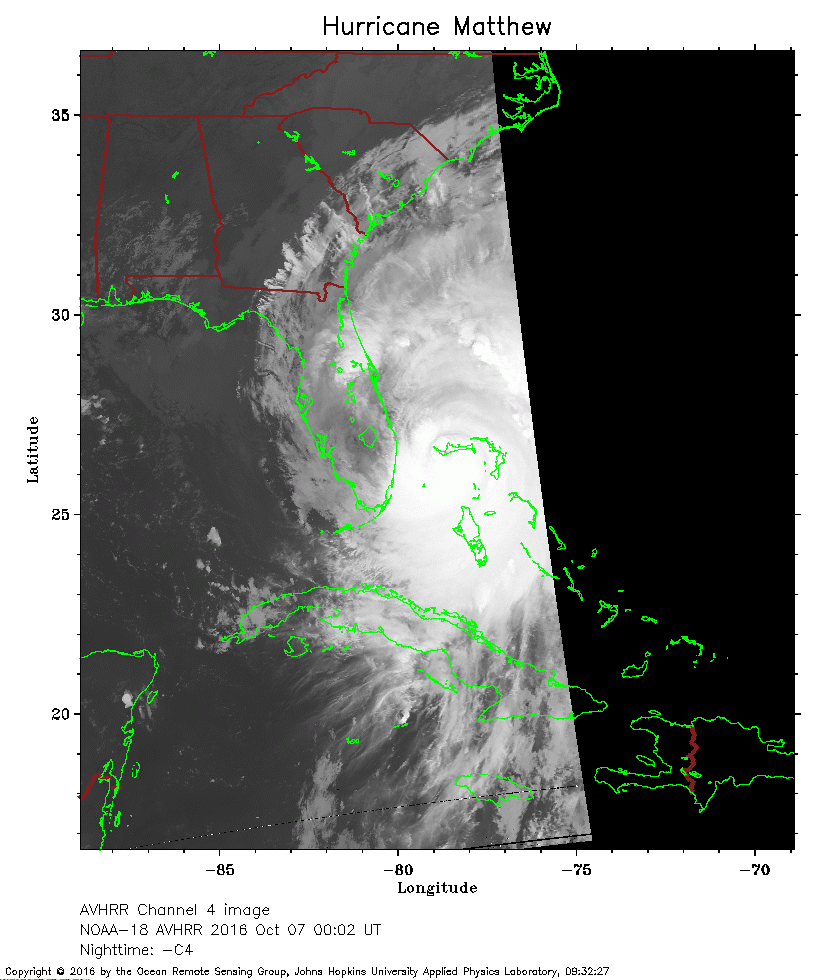 2016 October 07 00:02 UT
NOAA-18 satellite AVHRR channel 4 nighttime image.
A closer view (183 Kb) is seen by clicking on this small image.
The maximum sustained winds have decreased to 120 mph.
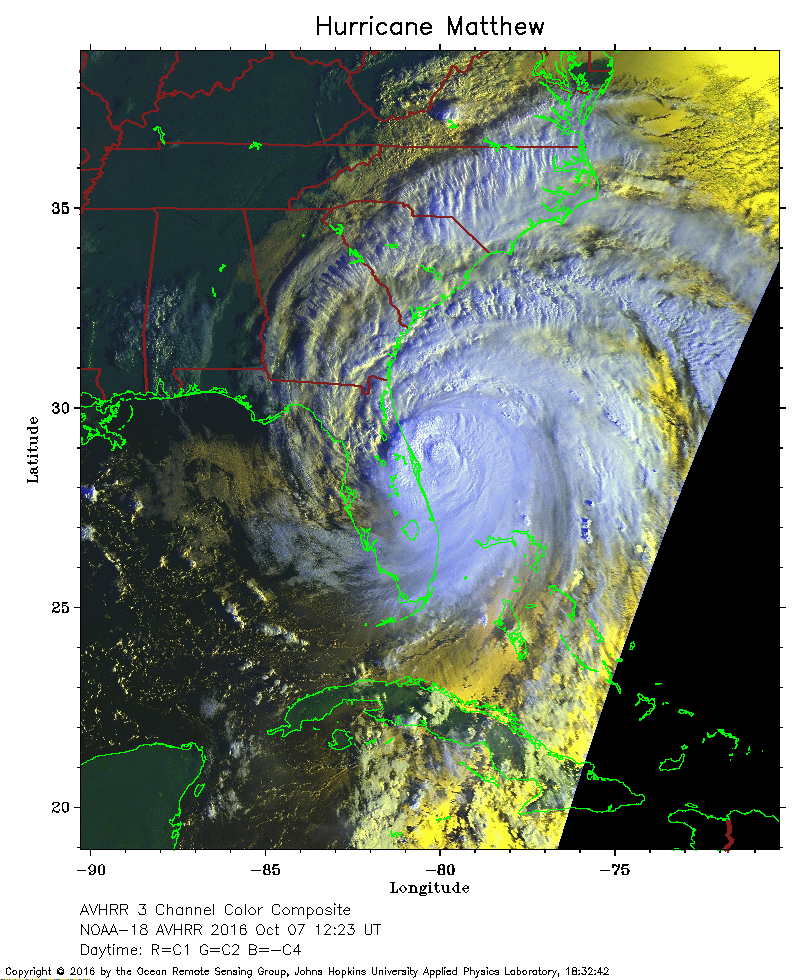 2016 October 07 12:23 UT
NOAA-18 satellite AVHRR 3 channel color composite daytime image.
A closer view (327 Kb) is seen by clicking on this small image.
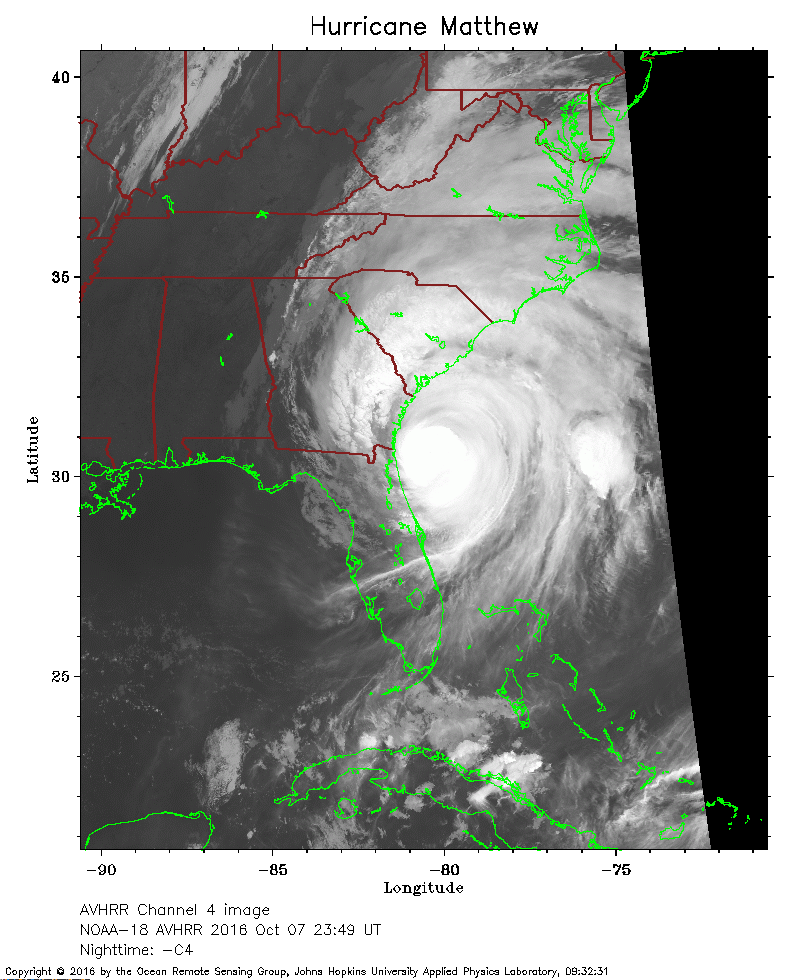 2016 October 07 23:49 UT
NOAA-18 satellite AVHRR channel 4 nighttime image.
A closer view (226 Kb) is seen by clicking on this small image.
The maximum sustained winds have decreased to 110 mph.
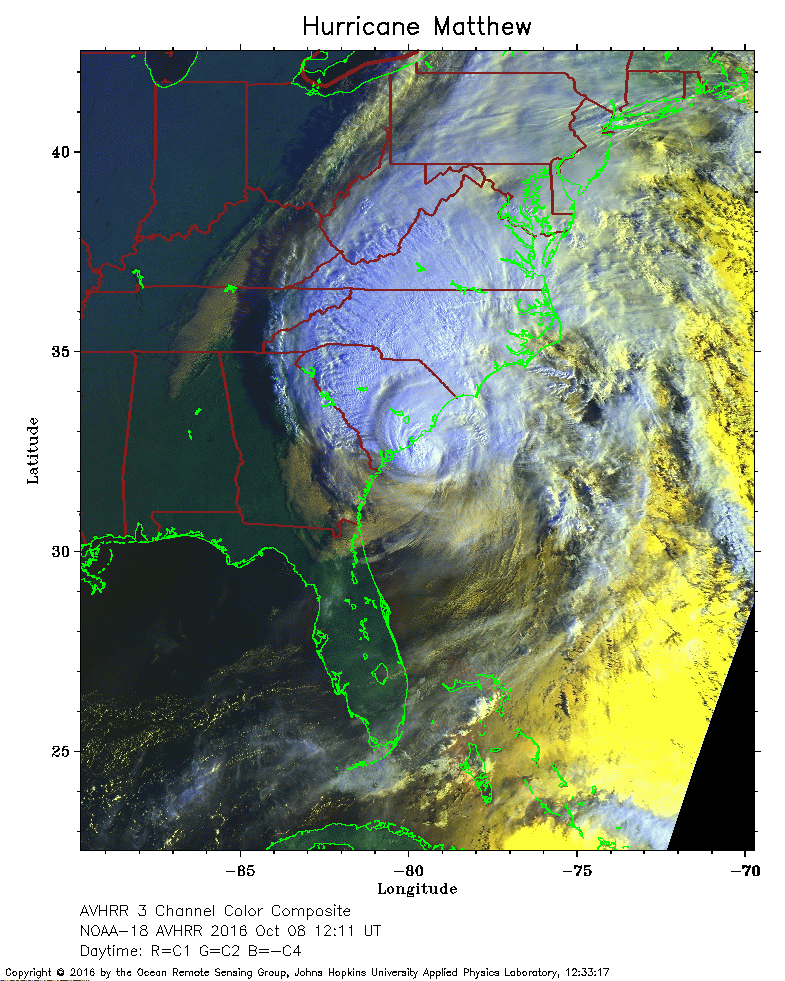 2016 October 08 12:11 UT
NOAA-18 satellite AVHRR 3 channel color composite daytime image.
A closer view (334 Kb) is seen by clicking on this small image.
The maximum sustained winds have decreased to 85 mph.
 2016 October 08 23:38 UT
NOAA-18 satellite AVHRR channel 4 nighttime image.
A closer view (201 Kb) is seen by clicking on this small image.
The maximum sustained winds have decreased to 75 mph.
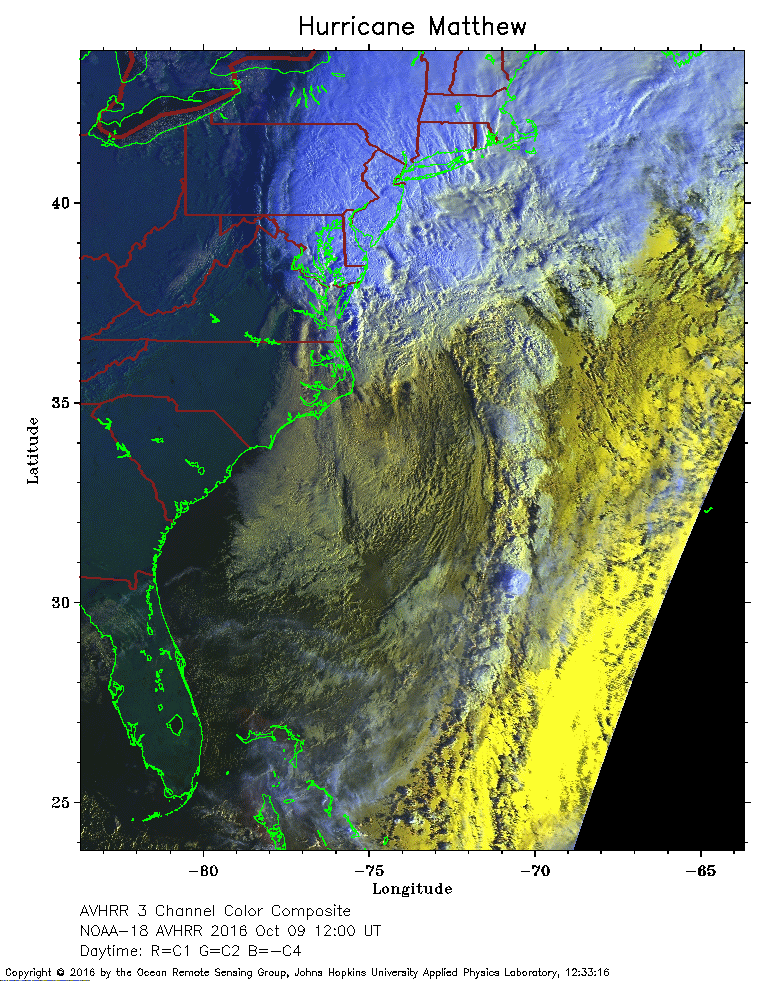 2016 October 09 12:00 UT
NOAA-18 satellite AVHRR 3 channel color composite daytime image.
A closer view (340 Kb) is seen by clicking on this small image.
Matthew has become a post-tropical cyclone with an exposed center and the nearest deep convection more than 150 nmi from this center.