
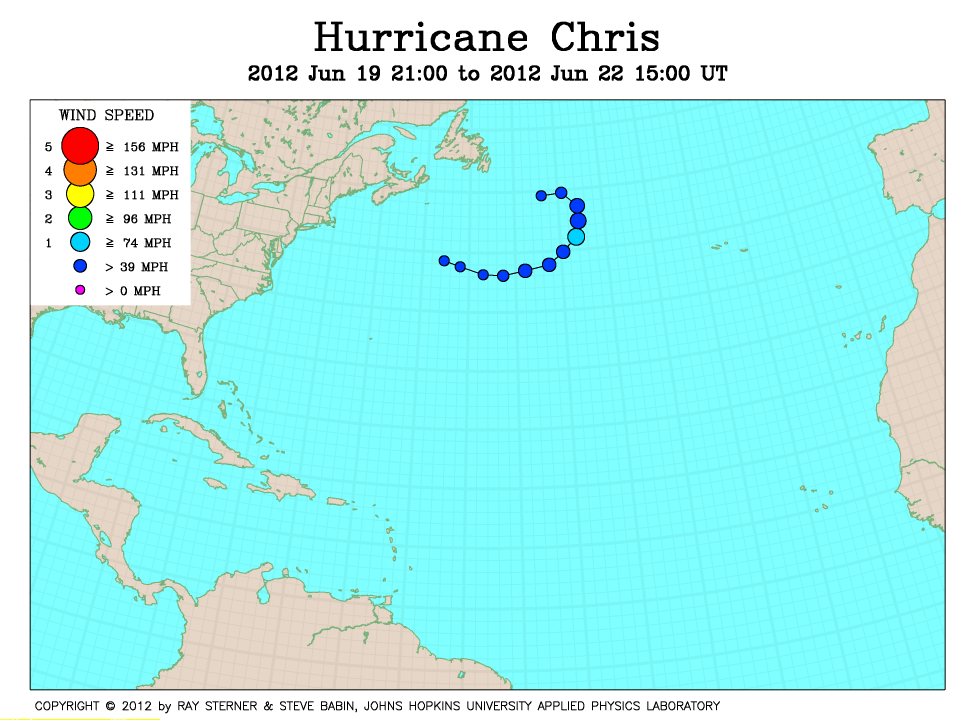
Track maps
Chris developed off the northeast US coast.
 Chris track on SST image of 18 June (312 Kb) This image
represents the average composite sea surface temperature (SST) derived from
NOAA satellite AVHRR data over the 7 days ending 18 June 2012. The
averaging is done to remove clouds. The temperature scale for SST is
12C to 32C. The track of Chris is overlaid on this image.
Chris track on SST image of 18 June (312 Kb) This image
represents the average composite sea surface temperature (SST) derived from
NOAA satellite AVHRR data over the 7 days ending 18 June 2012. The
averaging is done to remove clouds. The temperature scale for SST is
12C to 32C. The track of Chris is overlaid on this image.
Track file
Track data (lat/lon, winds, etc.) in a text file.