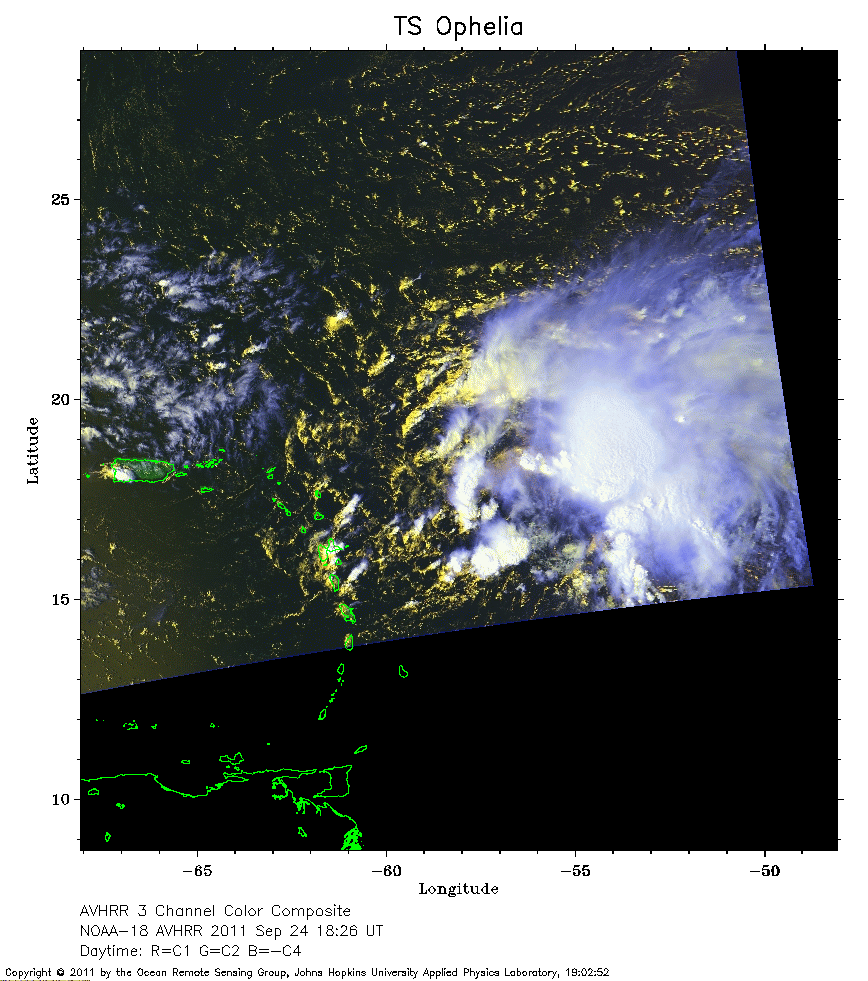
 2011 September 24 18:26 UT
NOAA-18 satellite AVHRR 3 channel color composite daytime image.
A closer view (245 Kb) is seen by clicking on this small image.
The maximum sustained winds are 50 mph.
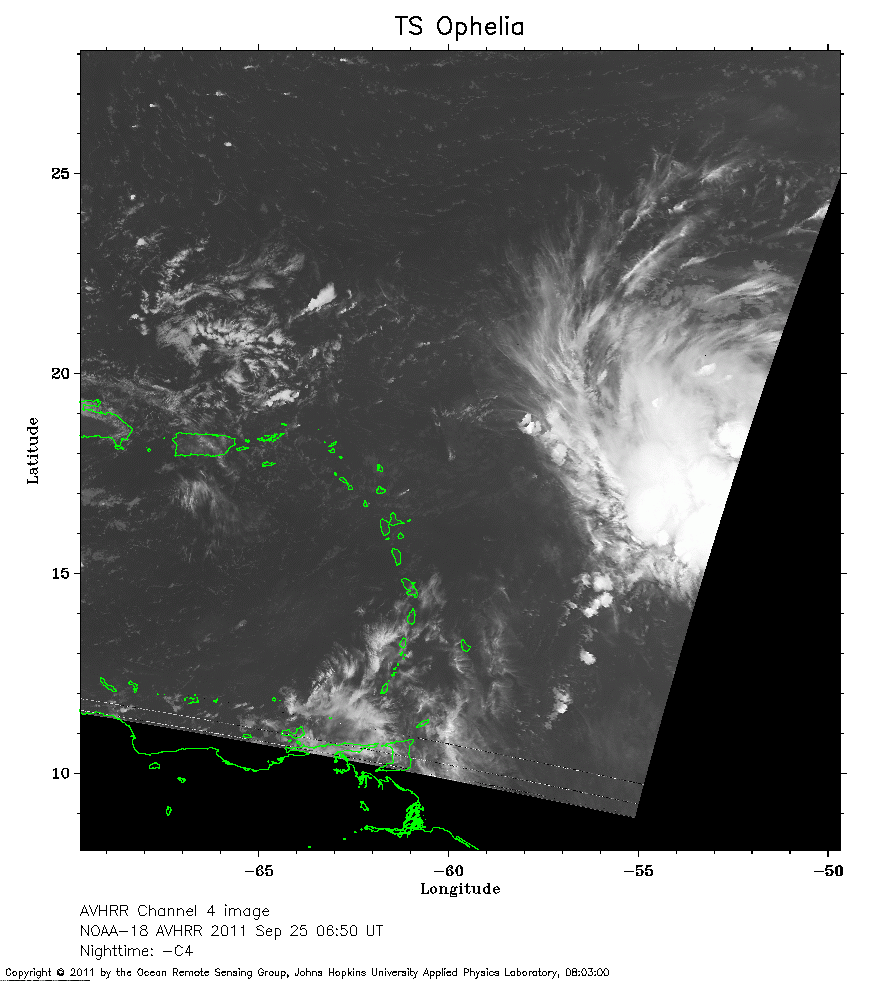 2011 September 25 06:50 UT
NOAA-18 satellite AVHRR channel 4 nighttime image.
A closer view (216 Kb) is seen by clicking on this small image.
The maximum sustained winds have decreased to 45 mph.
 2011 September 25 18:15 UT
NOAA-18 satellite AVHRR 3 channel color composite daytime image.
A closer view (243 Kb) is seen by clicking on this small image.
The maximum sustained winds have decreased to 40 mph.
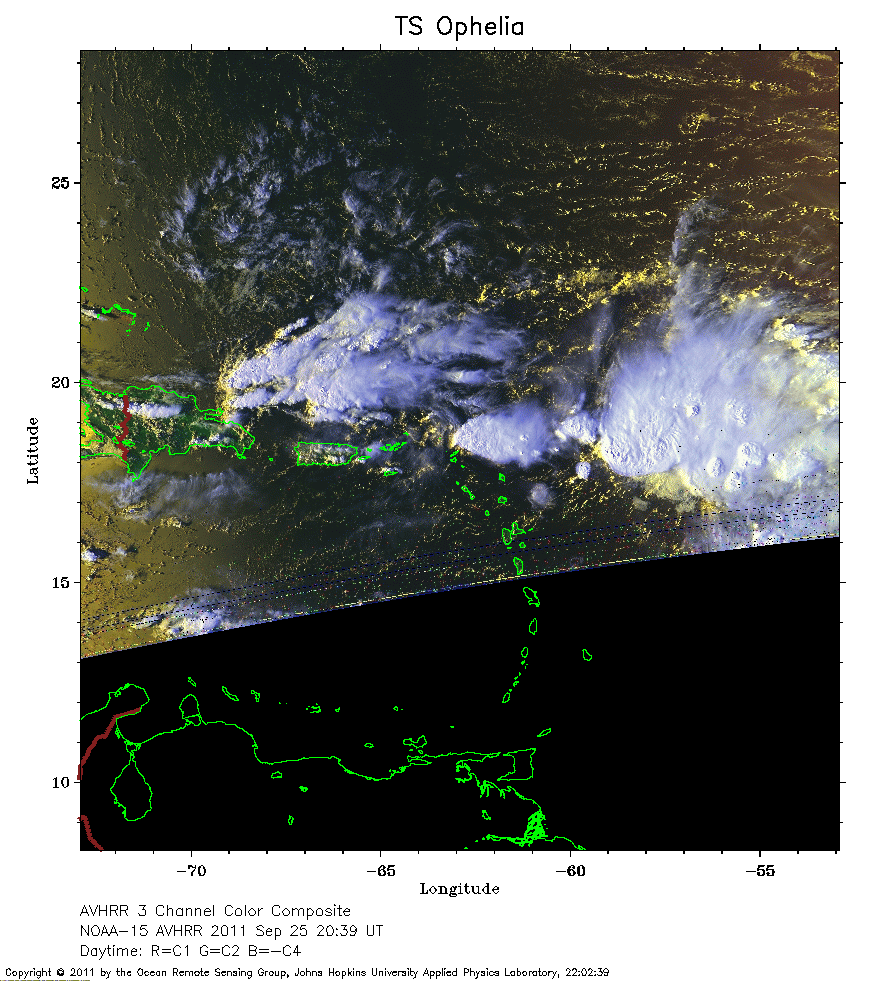 2011 September 25 20:39 UT
NOAA-15 satellite AVHRR channel 3 color composite daytime image.
A closer view (255 Kb) is seen by clicking on this small image.
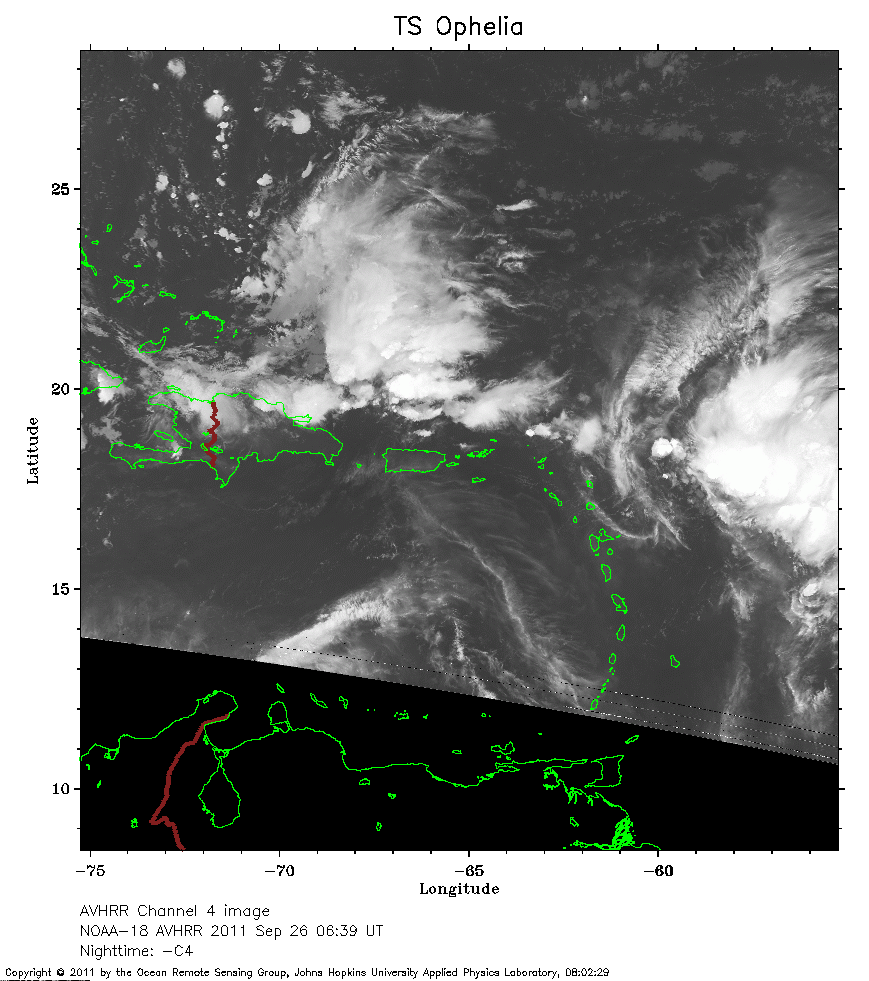 2011 September 26 06:39 UT
NOAA-18 satellite AVHRR channel 4 nighttime image.
A closer view (238 Kb) is seen by clicking on this small image.
Ophelia has dissipated to a remnant low.
 2011 September 25 18:05 UT
NOAA-18 satellite AVHRR channel 3 color composite daytime image.
A closer view (272 Kb) is seen by clicking on this small image.
Ophelia remains a remnant low.
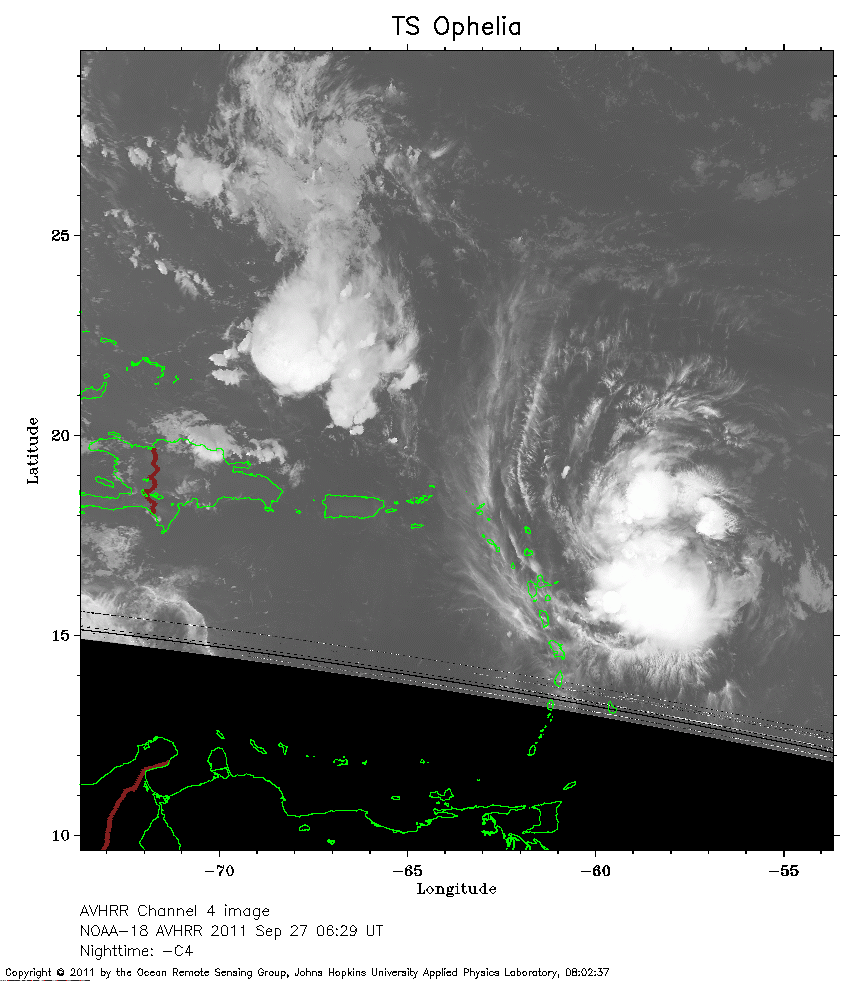 2011 September 27 06:29 UT
NOAA-18 satellite AVHRR channel 4 nighttime image.
A closer view (219 Kb) is seen by clicking on this small image.
Ophelia remains a remnant low.
 2011 September 27 17:54 UT
NOAA-18 satellite AVHRR channel 3 color composite daytime image.
A closer view (217 Kb) is seen by clicking on this small image.
Ophelia remains a remnant low.
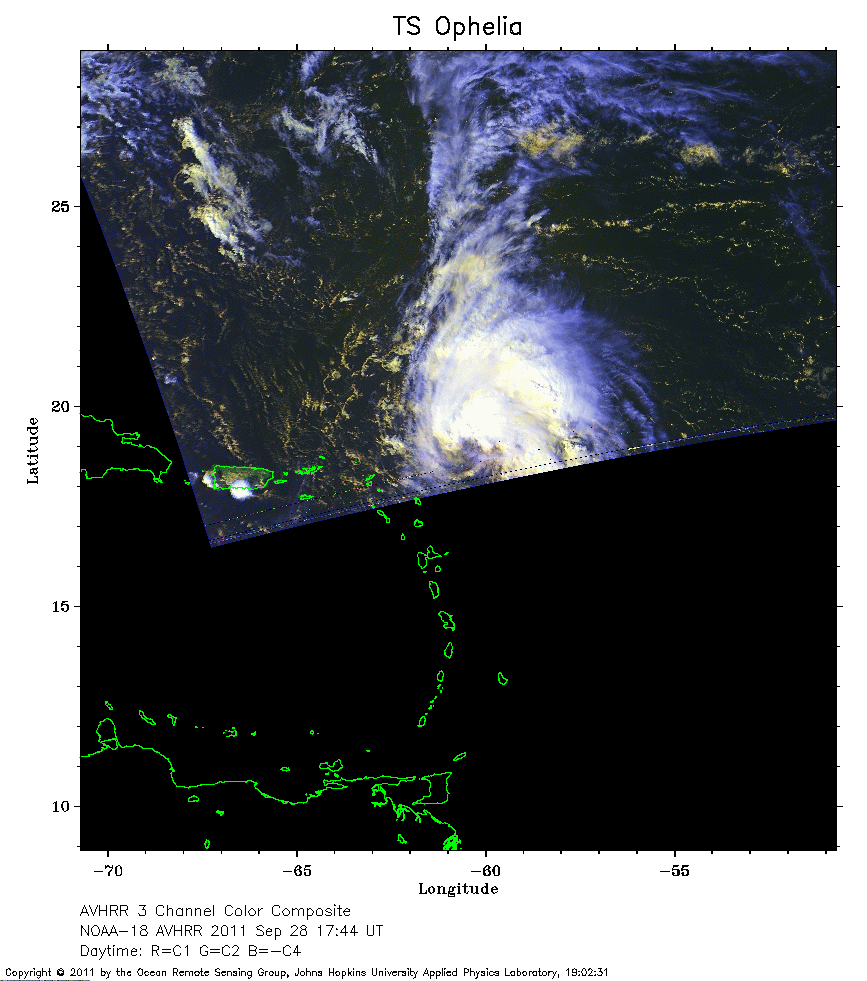 2011 September 28 17:44 UT
NOAA-18 satellite AVHRR 3 channel color composite daytime image.
A closer view (198 Kb) is seen by clicking on this small image.
Ophelia has regenerated into a tropical storm with 50 mph maximum sustained winds.
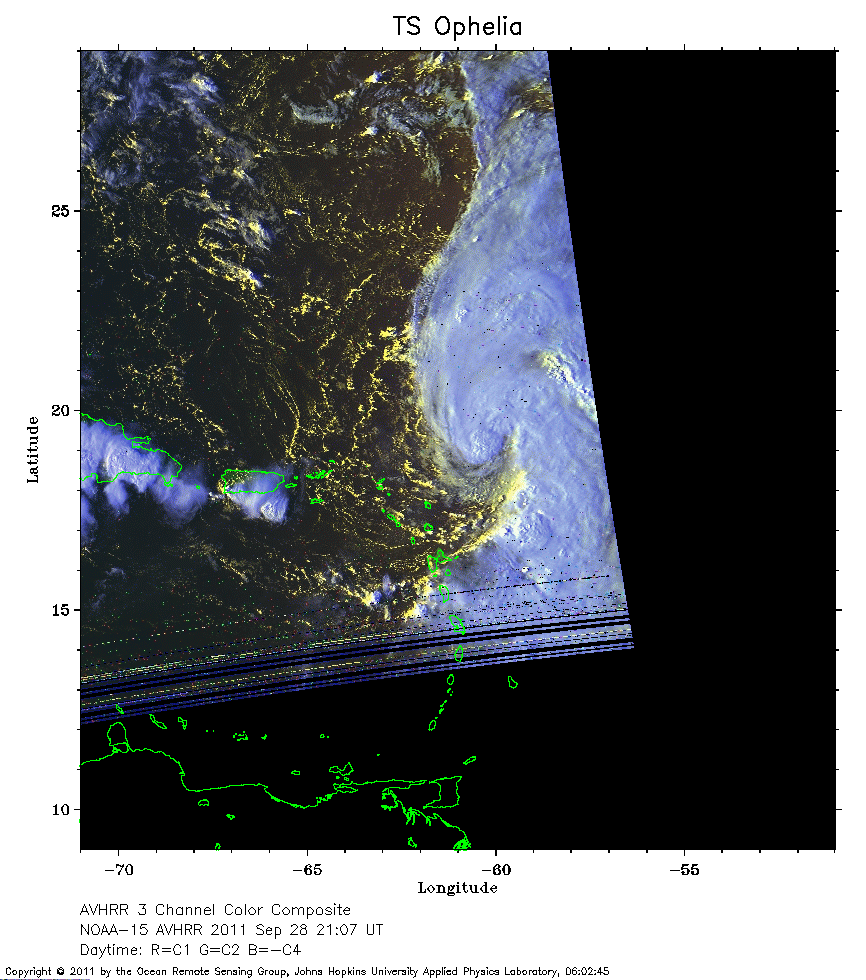 2011 September 28 21:07 UT
NOAA-15 satellite AVHRR channel 3 color composite daytime image.
A closer view (206 Kb) is seen by clicking on this small image.
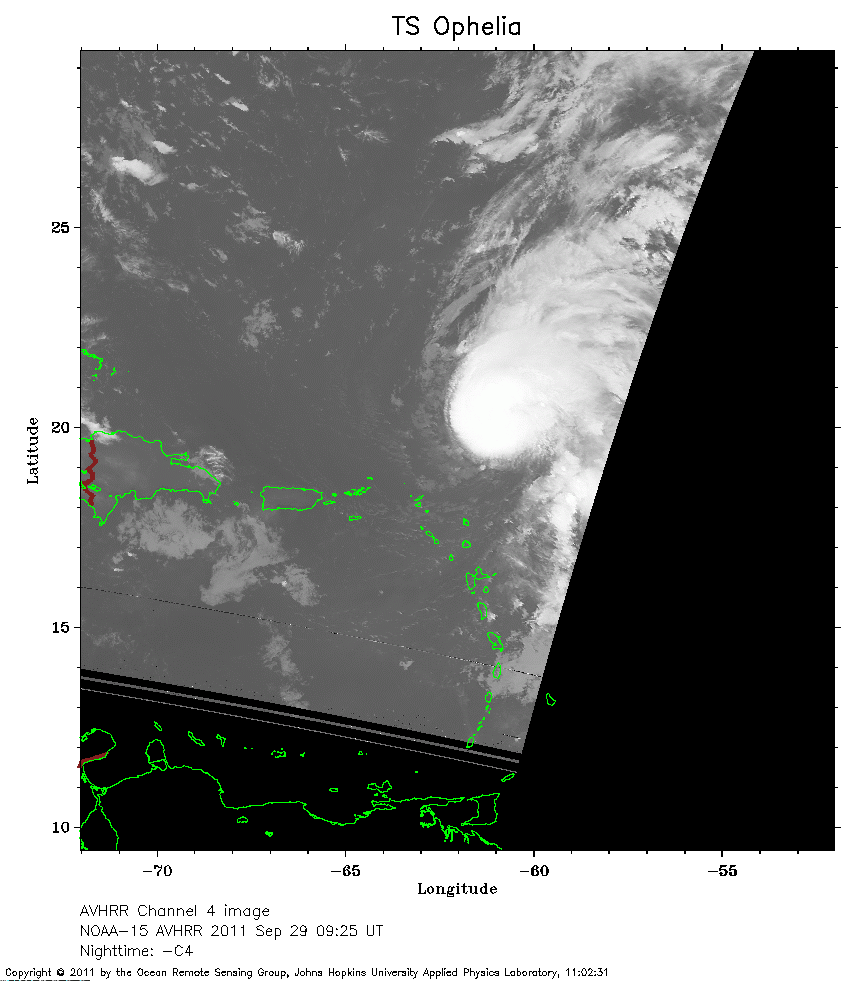 2011 September 29 09:25 UT
NOAA-15 satellite AVHRR channel 4 nighttime image.
A closer view (168 Kb) is seen by clicking on this small image.
The maximum sustained winds have increased to 60 mph.
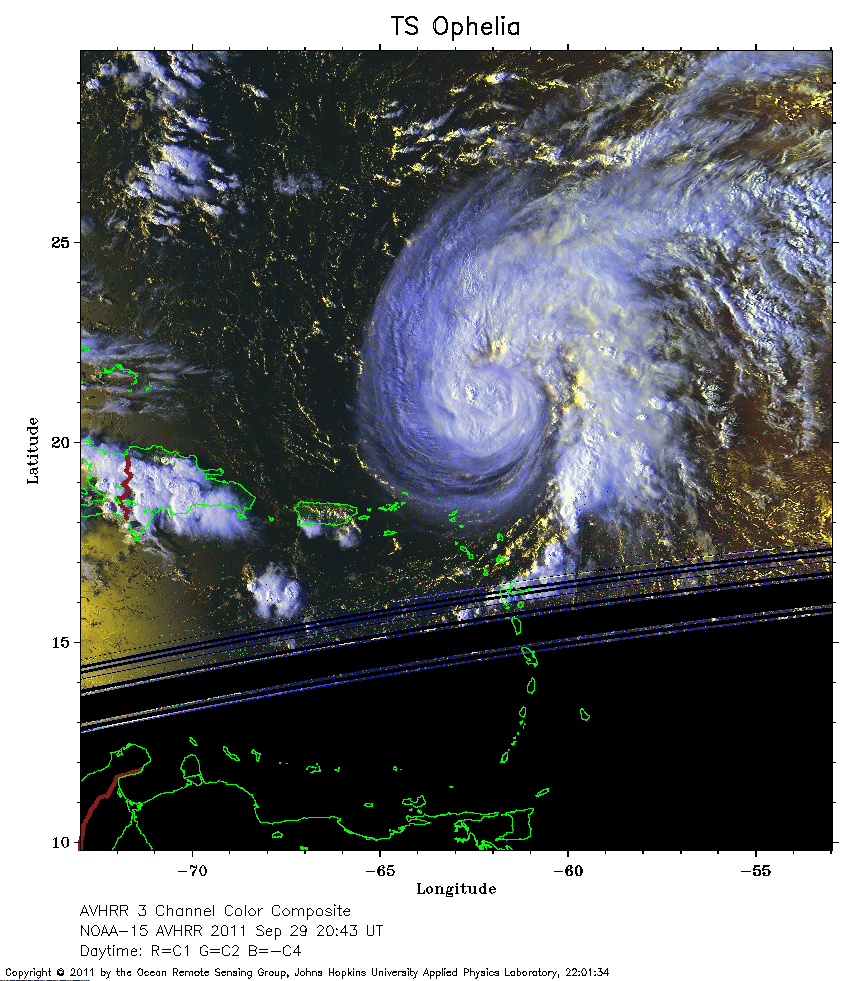 2011 September 29 20:43 UT
NOAA-15 satellite AVHRR channel 3 color composite daytime image.
A closer view (289 Kb) is seen by clicking on this small image.
The maximum sustained winds have increased to 70 mph.
 2011 September 30 19:02 UT
NOAA-18 satellite AVHRR 3 channel color composite daytime image.
A closer view (250 Kb) is seen by clicking on this small image.
The maximum sustained winds have increased to 115 mph, so Ophelia is now a Saffir-Simpson Category 3 hurricane.
 2011 October 01 18:51 UT
NOAA-18 satellite AVHRR channel 3 color composite daytime image.
A closer view (300 Kb) is seen by clicking on this small image.
The maximum sustained winds have increased to 120 mph.
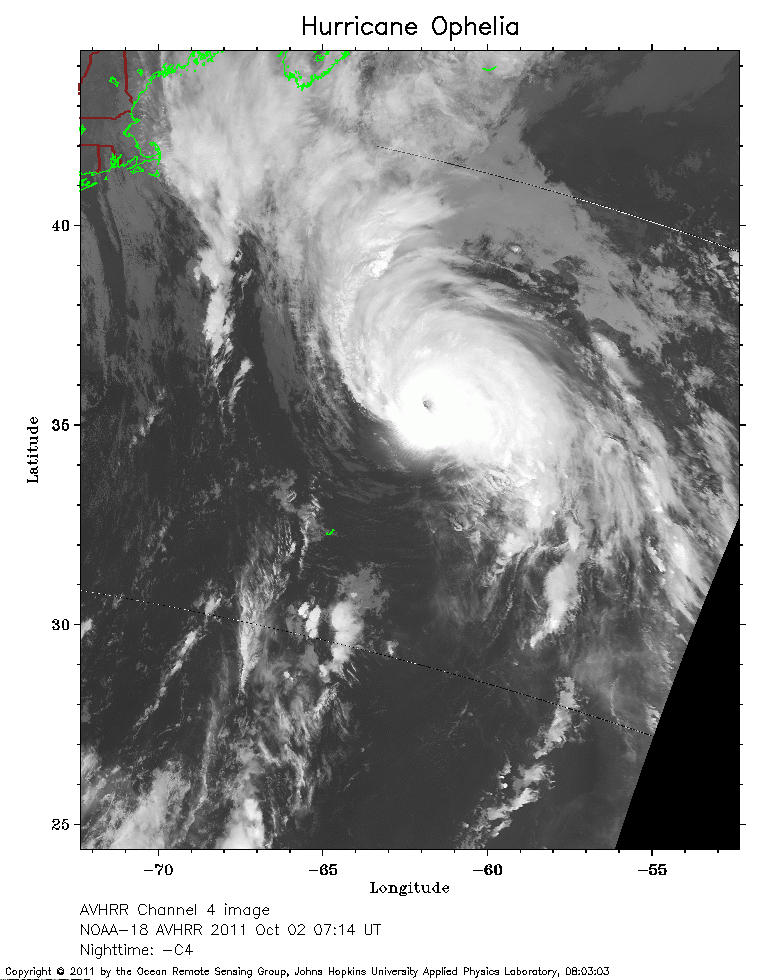 2011 October 02 07:14 UT
NOAA-18 satellite AVHRR channel 4 nighttime image.
A closer view (265 Kb) is seen by clicking on this small image.
The maximum sustained winds have increased to 140 mph, so Ophelia is now a Saffir-Simpson Category 4 hurricane.
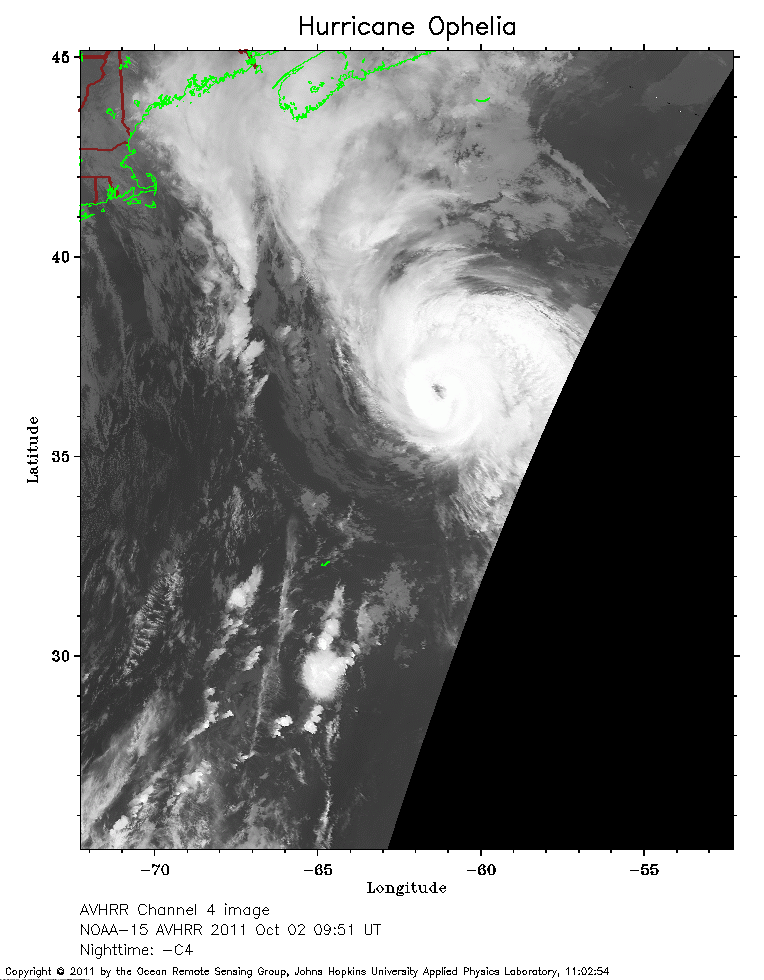 2011 October 02 09:51 UT
NOAA-15 satellite AVHRR channel 4 nighttime image.
A closer view (200 Kb) is seen by clicking on this small image.
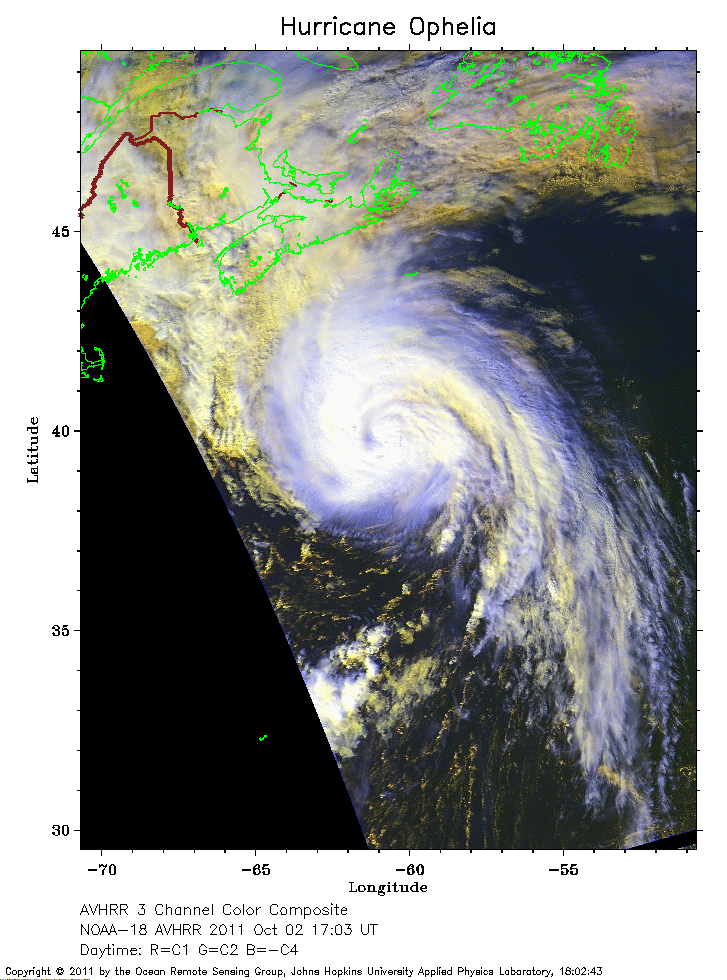 2011 October 02 17:03 UT
NOAA-18 satellite AVHRR 3 channel color composite daytime image.
A closer view (268 Kb) is seen by clicking on this small image.
The maximum sustained winds have decreased to 110 mph.
 2011 October 02 18:40 UT
NOAA-18 satellite AVHRR 3 channel color composite daytime image.
A closer view (261 Kb) is seen by clicking on this small image.
The maximum sustained winds have decreased to 105 mph.
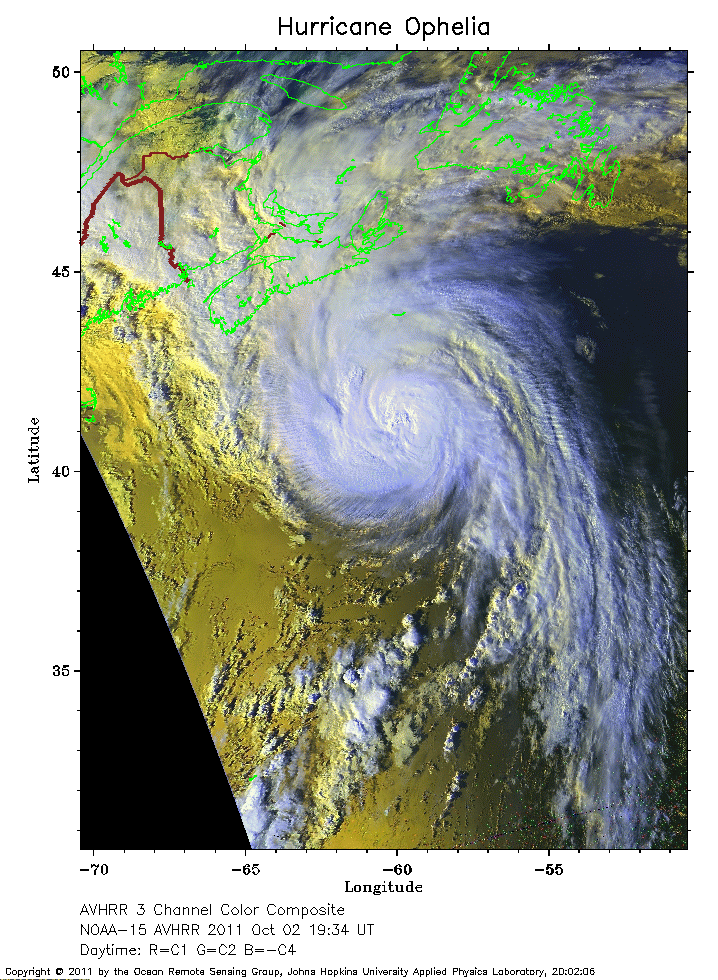 2011 October 02 19:34 UT
NOAA-15 satellite AVHRR 3 channel color composite daytime image.
A closer view (335 Kb) is seen by clicking on this small image.
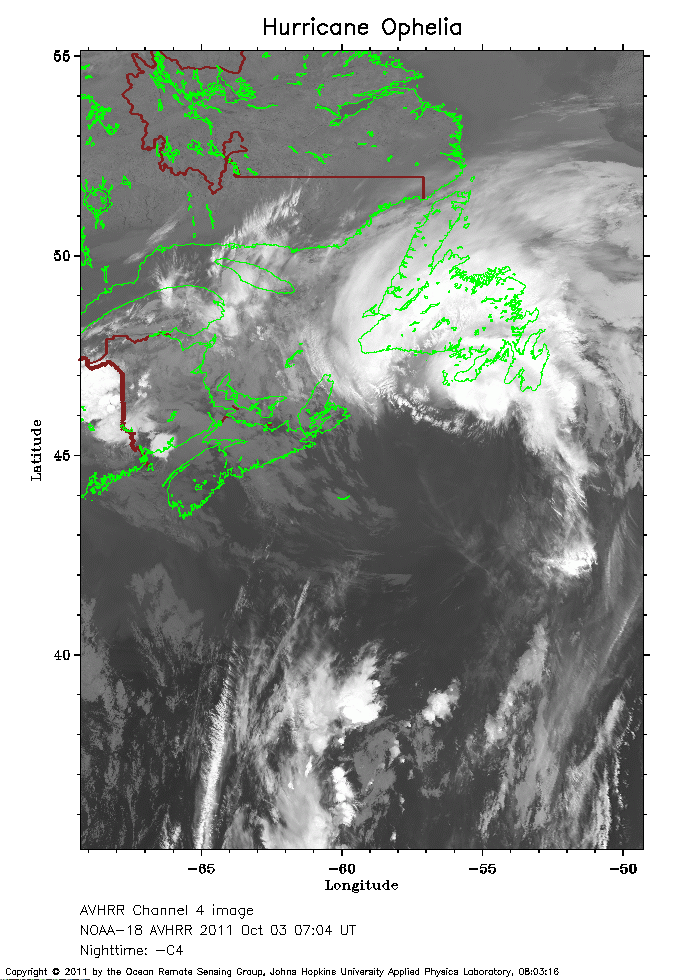 2011 October 03 07:04 UT
NOAA-18 satellite AVHRR channel 4 nighttime image.
A closer view (228 Kb) is seen by clicking on this small image.
The maximum sustained winds have decreased to 75 mph.