 2008 November 06 15:23 UT
NOAA-17 satellite AVHRR 3 channel color composite daytime image.
A closer view (238 Kb) is seen by clicking on this small image.
The maximum sustained winds are 45 mph.
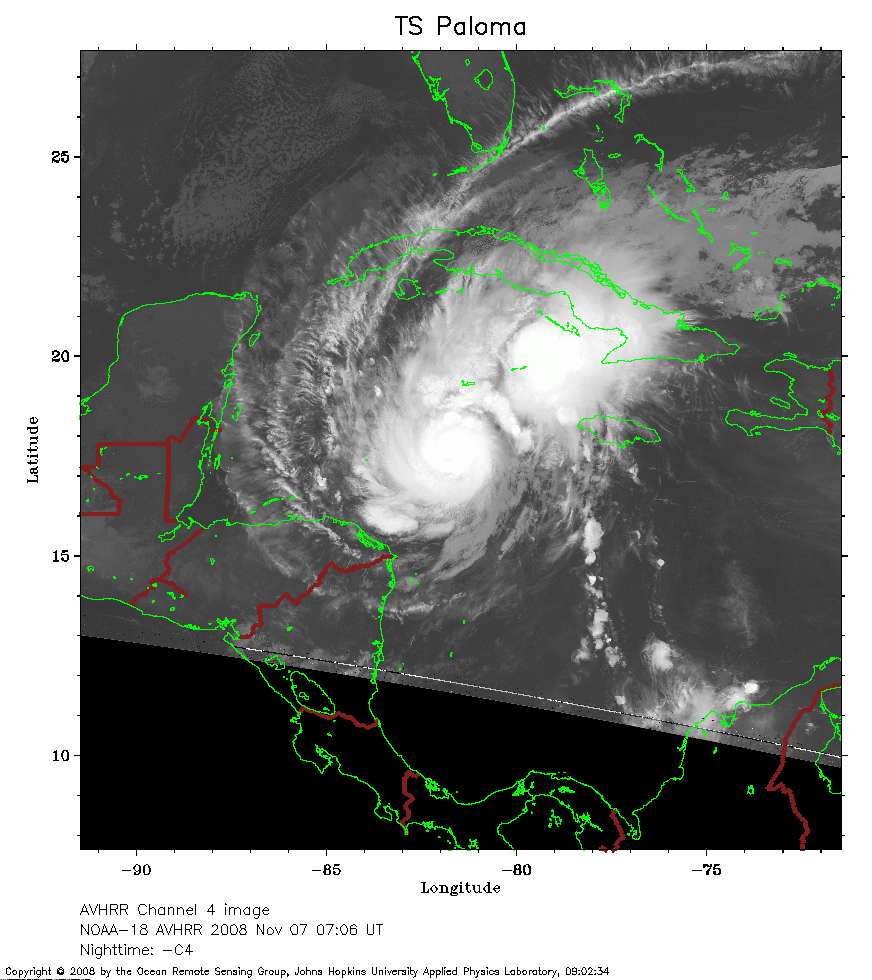 2008 November 07 07:06 UT
NOAA-18 satellite AVHRR channel 4 nighttime image.
A closer view (239 Kb) is seen by clicking on this small image.
The maximum sustained winds have increased to 75 mph, making Paloma a hurricane.
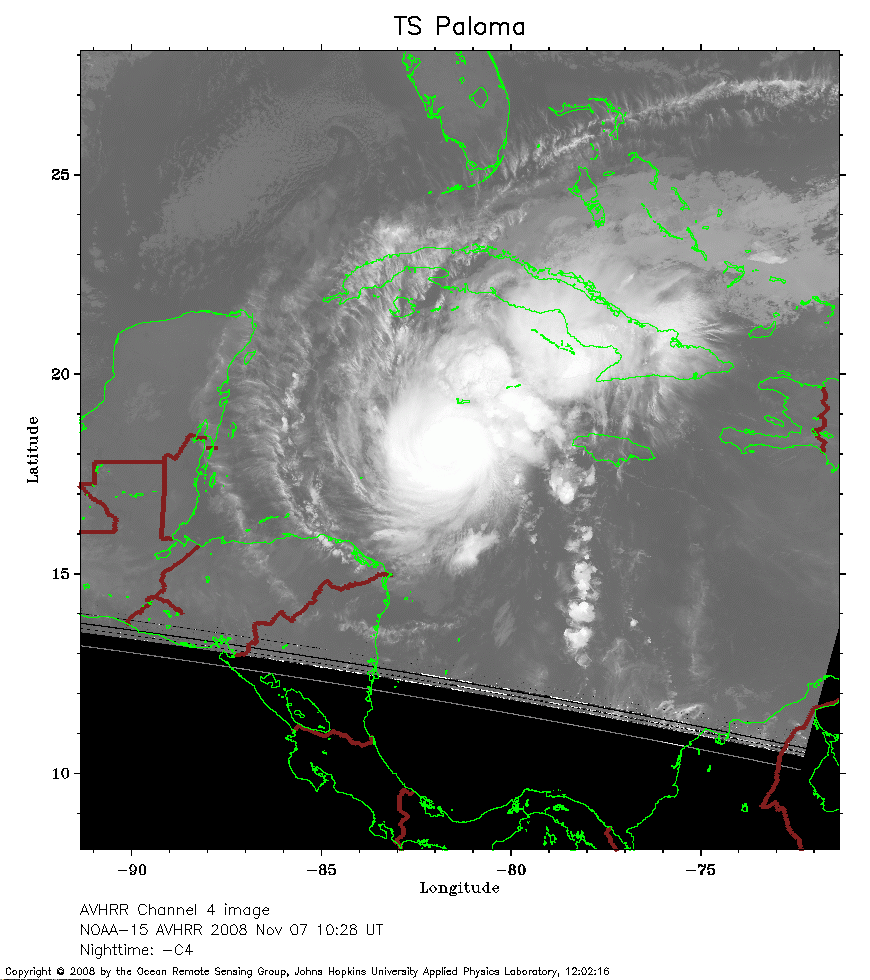 2008 November 07 10:28 UT
NOAA-15 satellite AVHRR channel 4 nighttime image.
A closer view (215 Kb) is seen by clicking on this small image.
The maximum sustained winds have increased to 80 mph.
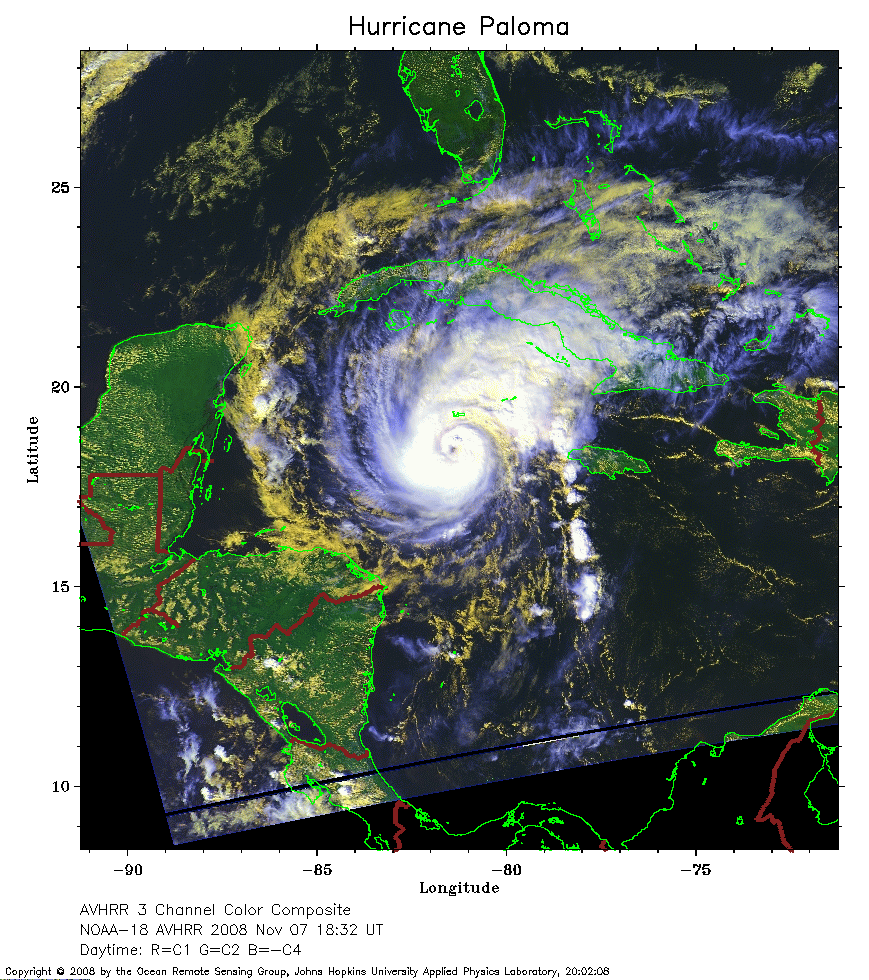 2008 November 07 18:32 UT
NOAA-18 satellite AVHRR 3 channel color composite daytime image.
A closer view (354 Kb) is seen by clicking on this small image.
The maximum sustained winds have increased to 90 mph.
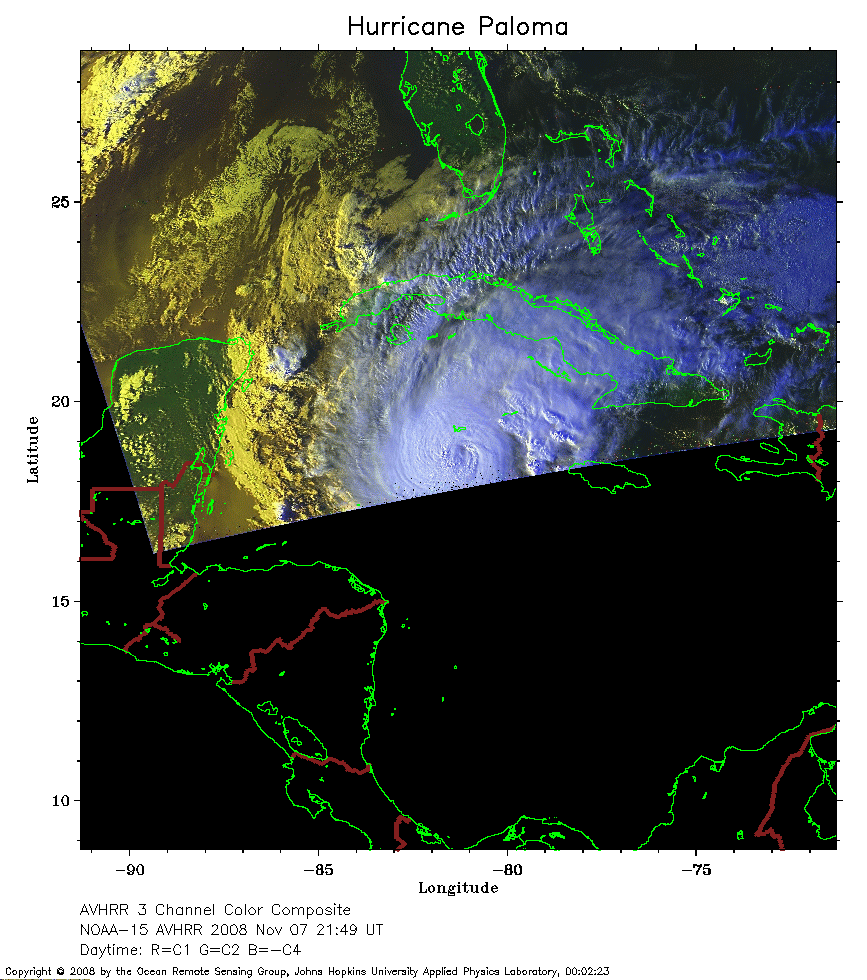 2008 November 07 21:49 UT
NOAA-15 satellite AVHRR 3 channel color composite daytime image.
A closer view (240 Kb) is seen by clicking on this small image.
The maximum sustained winds have increased to 105 mph.
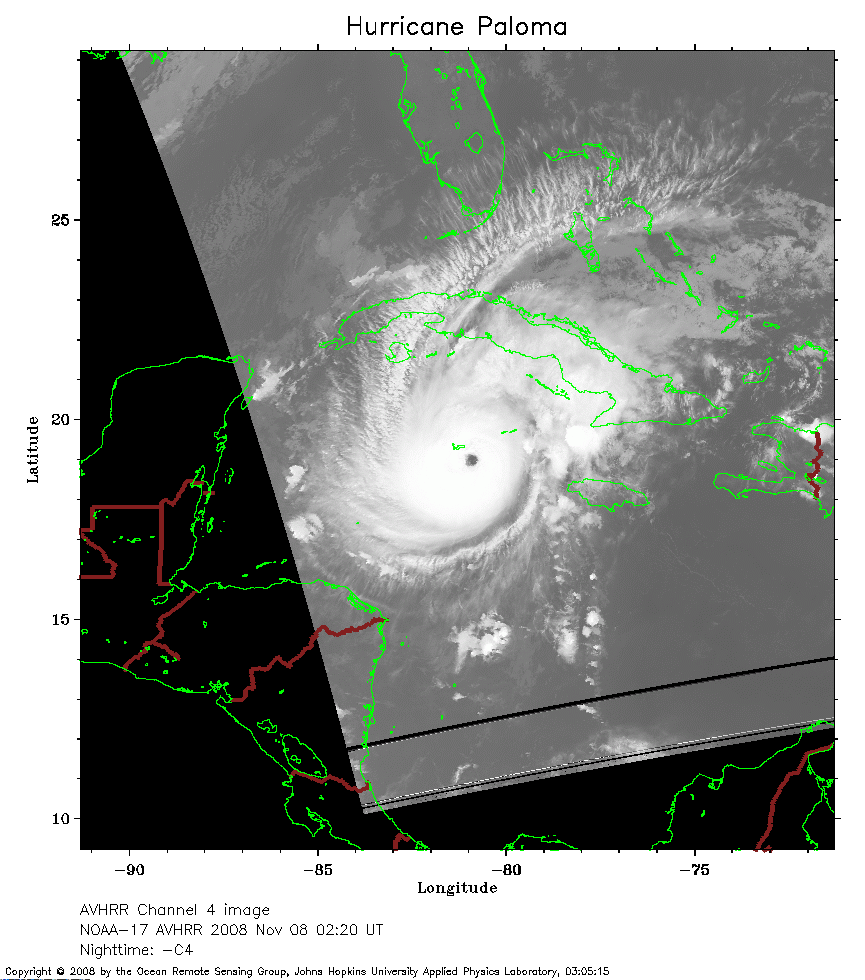 2008 November 08 02:20 UT
NOAA-17 satellite AVHRR channel 4 nighttime image.
A closer view (203 Kb) is seen by clicking on this small image.
The maximum sustained winds have increased to 115 mph.
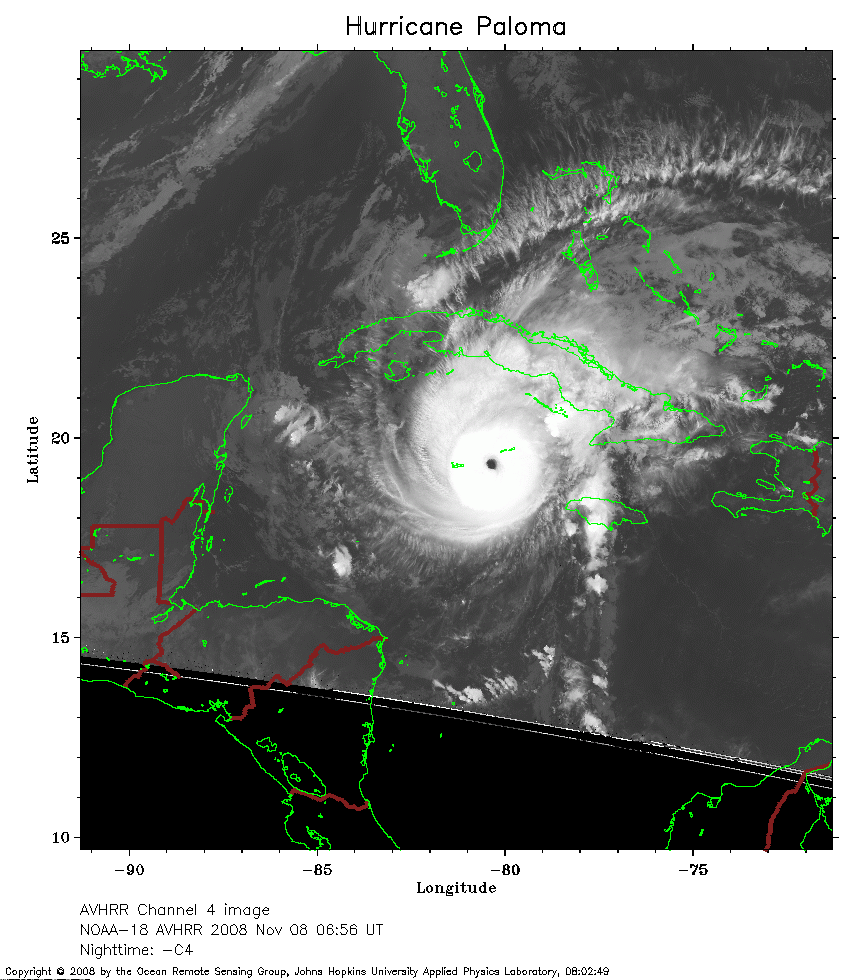 2008 November 08 06:56 UT
NOAA-18 satellite AVHRR channel 4 nighttime image.
A closer view (243 Kb) is seen by clicking on this small image.
The maximum sustained winds have increased to 120 mph.
 2008 November 08 14:37 UT
NOAA-17 satellite AVHRR 3 channel color composite daytime image.
A closer view (276 Kb) is seen by clicking on this small image.
The maximum sustained winds have increased to 140 mph.
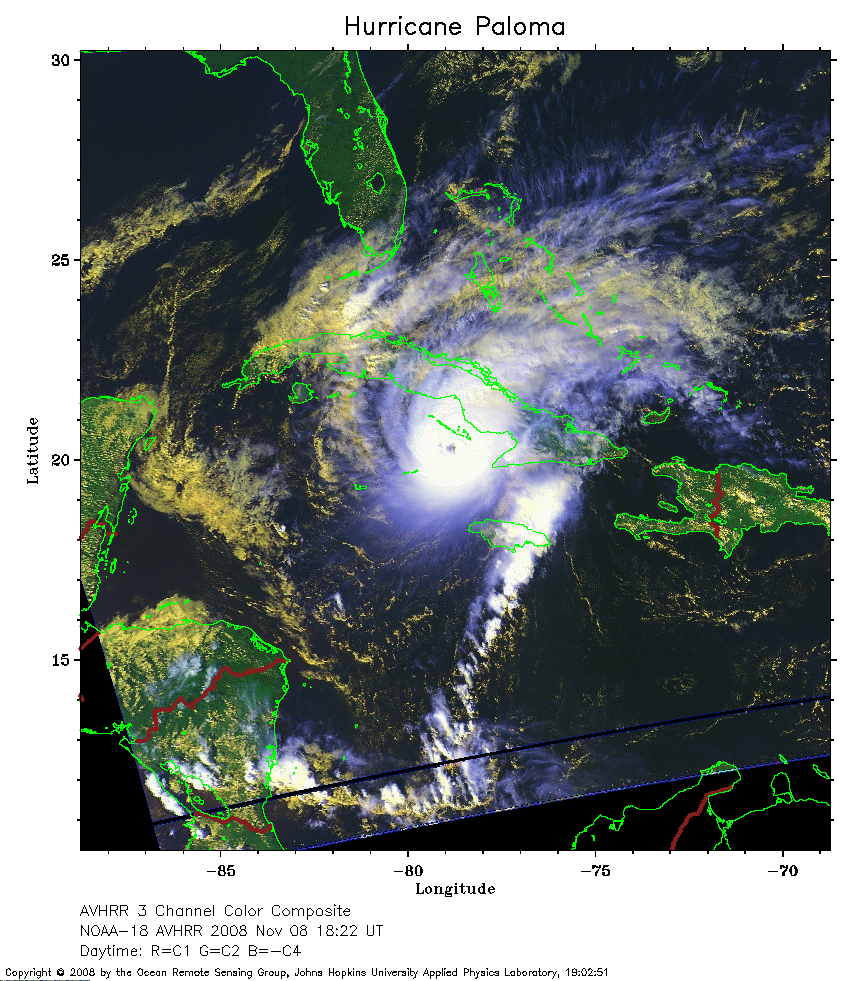 2008 November 08 18:22 UT
NOAA-18 satellite AVHRR 3 channel color composite daytime image.
A closer view (331 Kb) is seen by clicking on this small image.
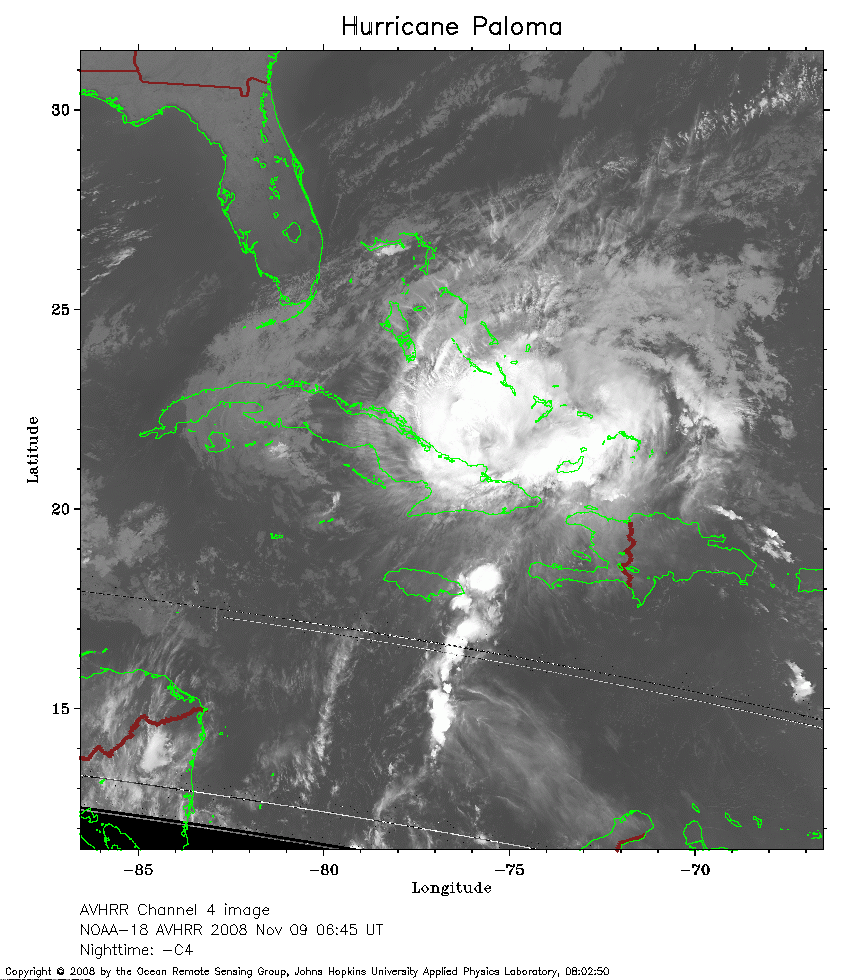 2008 November 09 06:45 UT
NOAA-18 satellite AVHRR channel 4 nighttime image.
A closer view (270 Kb) is seen by clicking on this small image.
Paloma is believed to have made landfull near Santa Cruz del Sur, Cuba,
at around 2320 UT with maximum sustained winds near 125 mph.
The maximum sustained winds have since decreased to 100 mph.
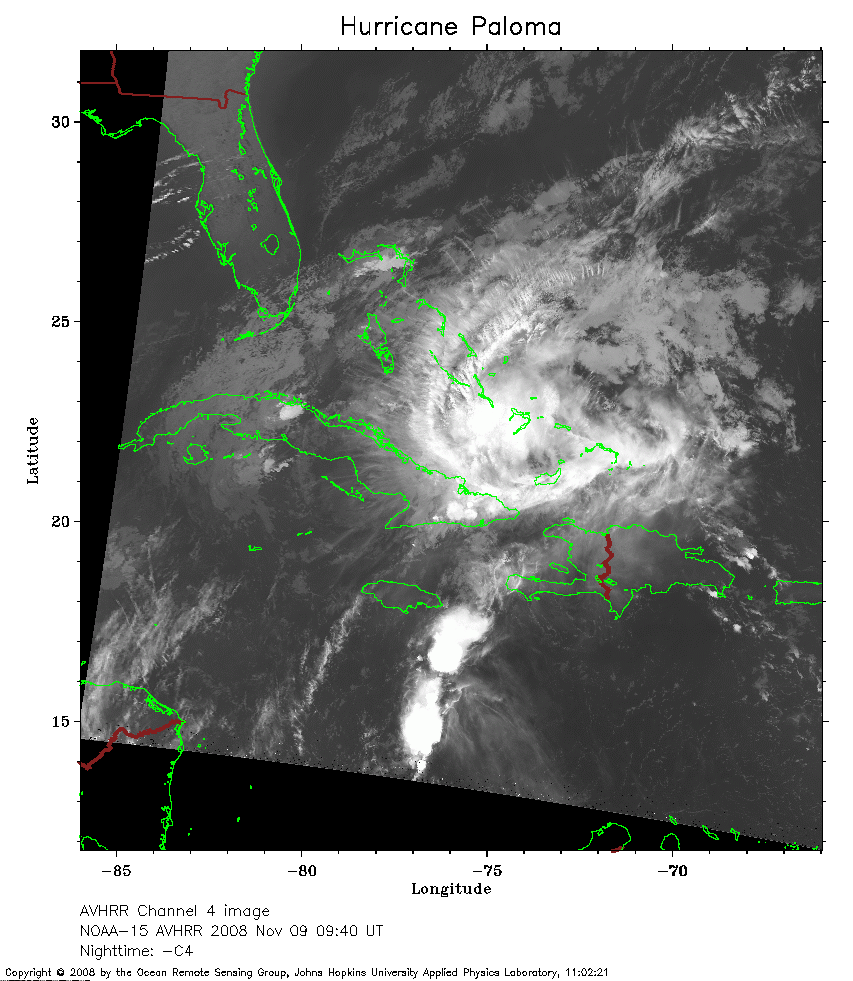 2008 November 09 09:40 UT
NOAA-15 satellite AVHRR channel 4 nighttime image.
A closer view (254 Kb) is seen by clicking on this small image.
The maximum sustained winds have decreased to 85 mph.
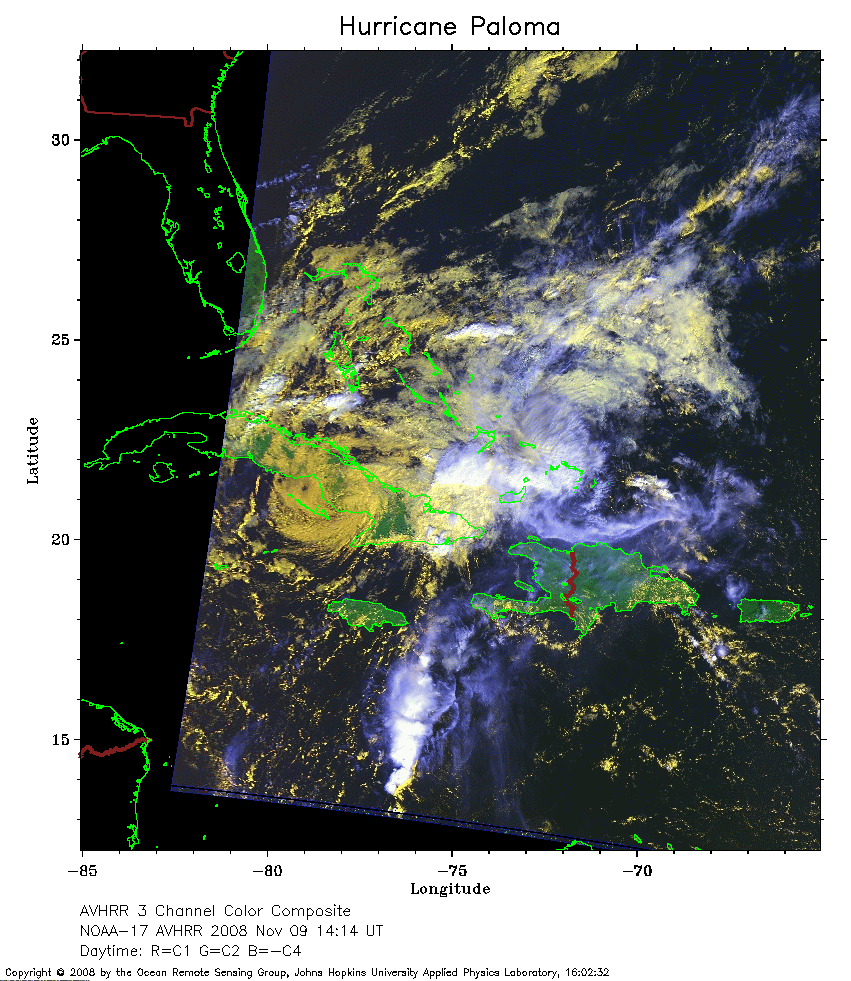 2008 November 09 14:14 UT
NOAA-17 satellite AVHRR 3 channel color composite daytime image.
A closer view (293 Kb) is seen by clicking on this small image.
The maximum sustained winds have decreased to 70 mph.
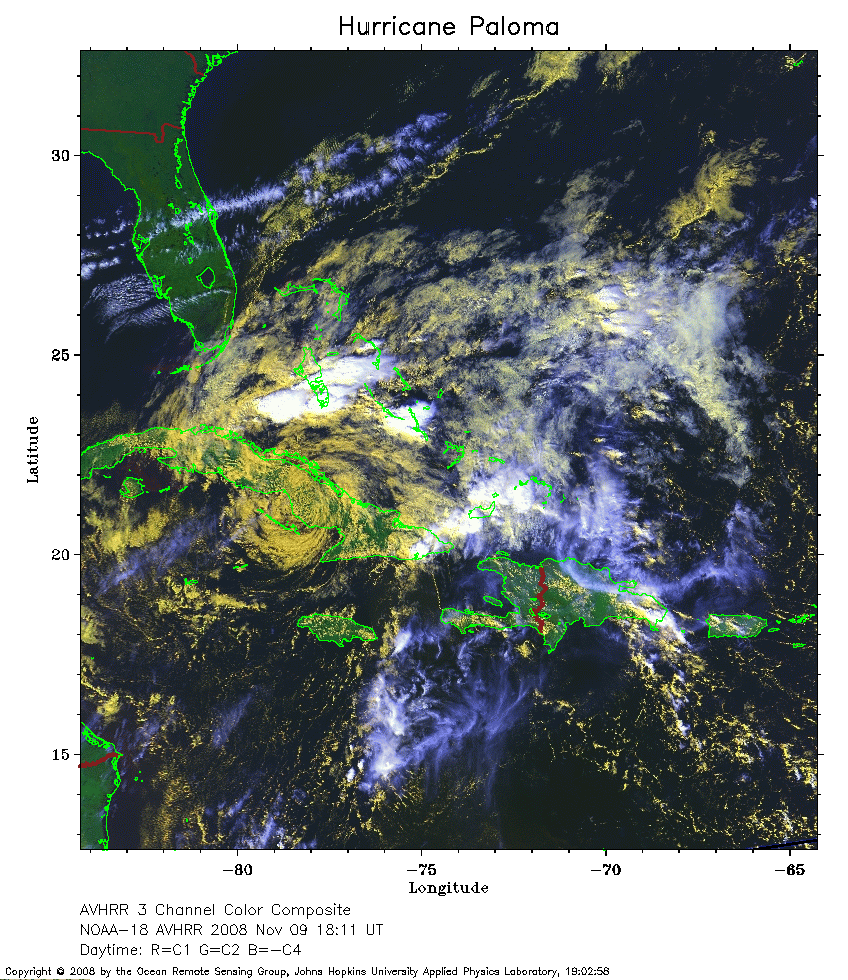 2008 November 09 18:11 UT
NOAA-18 satellite AVHRR 3 channel color composite daytime image.
A closer view (363 Kb) is seen by clicking on this small image.
The maximum sustained winds have decreased to 60 mph.
 2008 November 09 20:59 UT
NOAA-15 satellite AVHRR 3 channel color composite daytime image.
A closer view (312 Kb) is seen by clicking on this small image.
The maximum sustained winds have decreased to 35 mph.