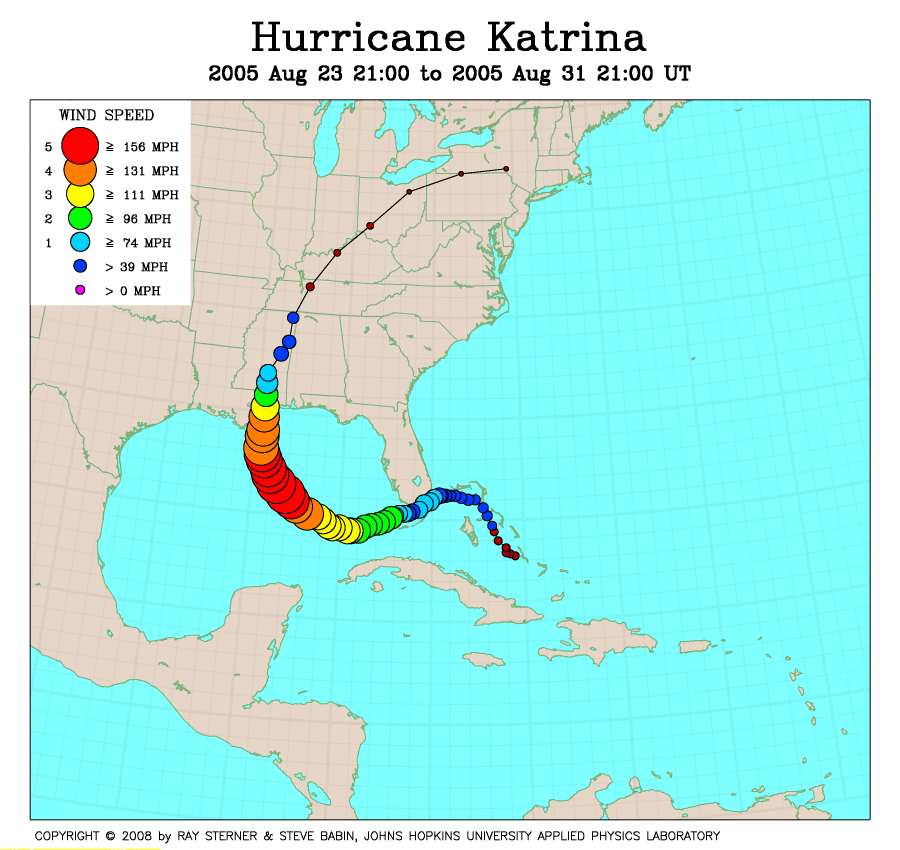
Track maps
Katrina developed from Tropical Depression Twelve in the western Atlantic
Ocean.
 Katrina track on SST image of the Atlantic Ocean from 23
August (259 Kb)
This image represents the average composite sea surface temperature (SST)
derived from NOAA satellite AVHRR data over the 7 days ending 23 August 2005.
The averaging is done to remove clouds. The temperature scale for SST is 24C
to 32C. The track of Katrina is overlaid on this image.
Katrina track on SST image of the Atlantic Ocean from 23
August (259 Kb)
This image represents the average composite sea surface temperature (SST)
derived from NOAA satellite AVHRR data over the 7 days ending 23 August 2005.
The averaging is done to remove clouds. The temperature scale for SST is 24C
to 32C. The track of Katrina is overlaid on this image.
 Katrina track on SST image of the Gulf of Mexico from 26
August (270 Kb)
This image represents the average composite sea surface temperature (SST)
derived from NOAA satellite AVHRR data over the 7 days ending 26 August 2005.
The averaging is done to remove clouds. The temperature scale for SST is 25C
to 32C. The track of Katrina is overlaid on this image.
Katrina track on SST image of the Gulf of Mexico from 26
August (270 Kb)
This image represents the average composite sea surface temperature (SST)
derived from NOAA satellite AVHRR data over the 7 days ending 26 August 2005.
The averaging is done to remove clouds. The temperature scale for SST is 25C
to 32C. The track of Katrina is overlaid on this image.
Track file
Track data (lat/lon, winds, etc.) in a text file.
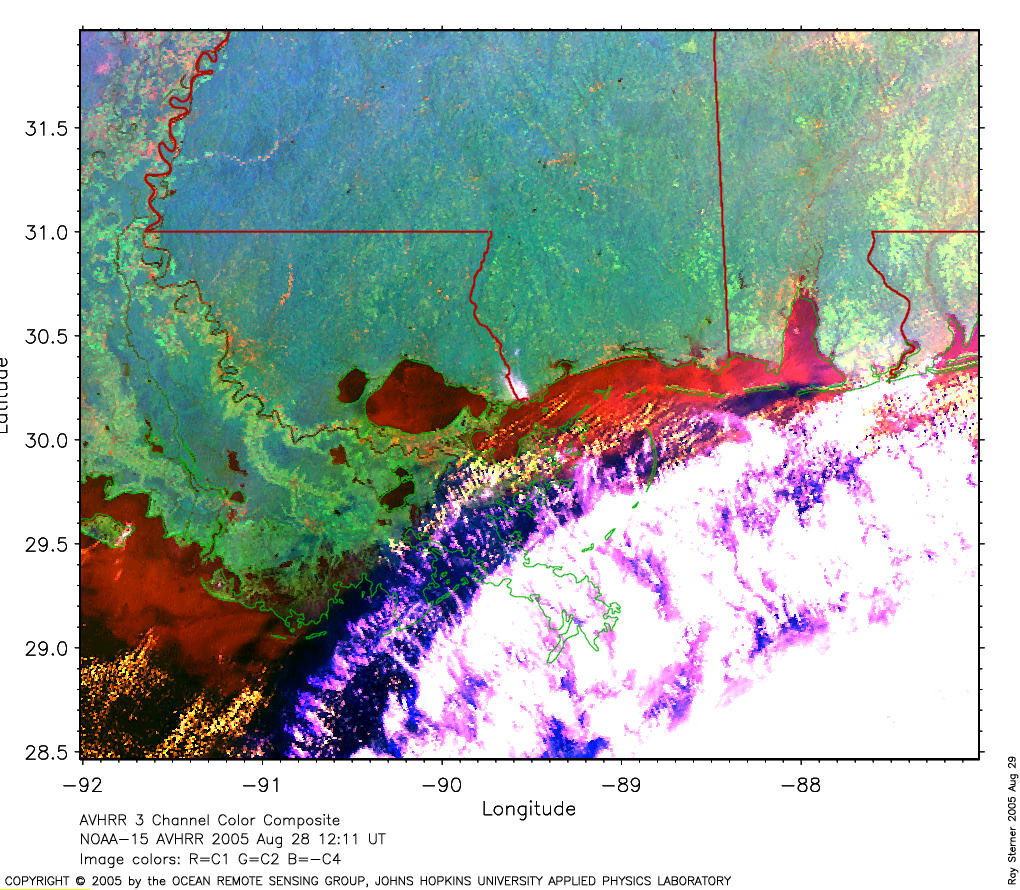
Louisiana and Mississippi
Gulf coast before Katrina (709 Kb)
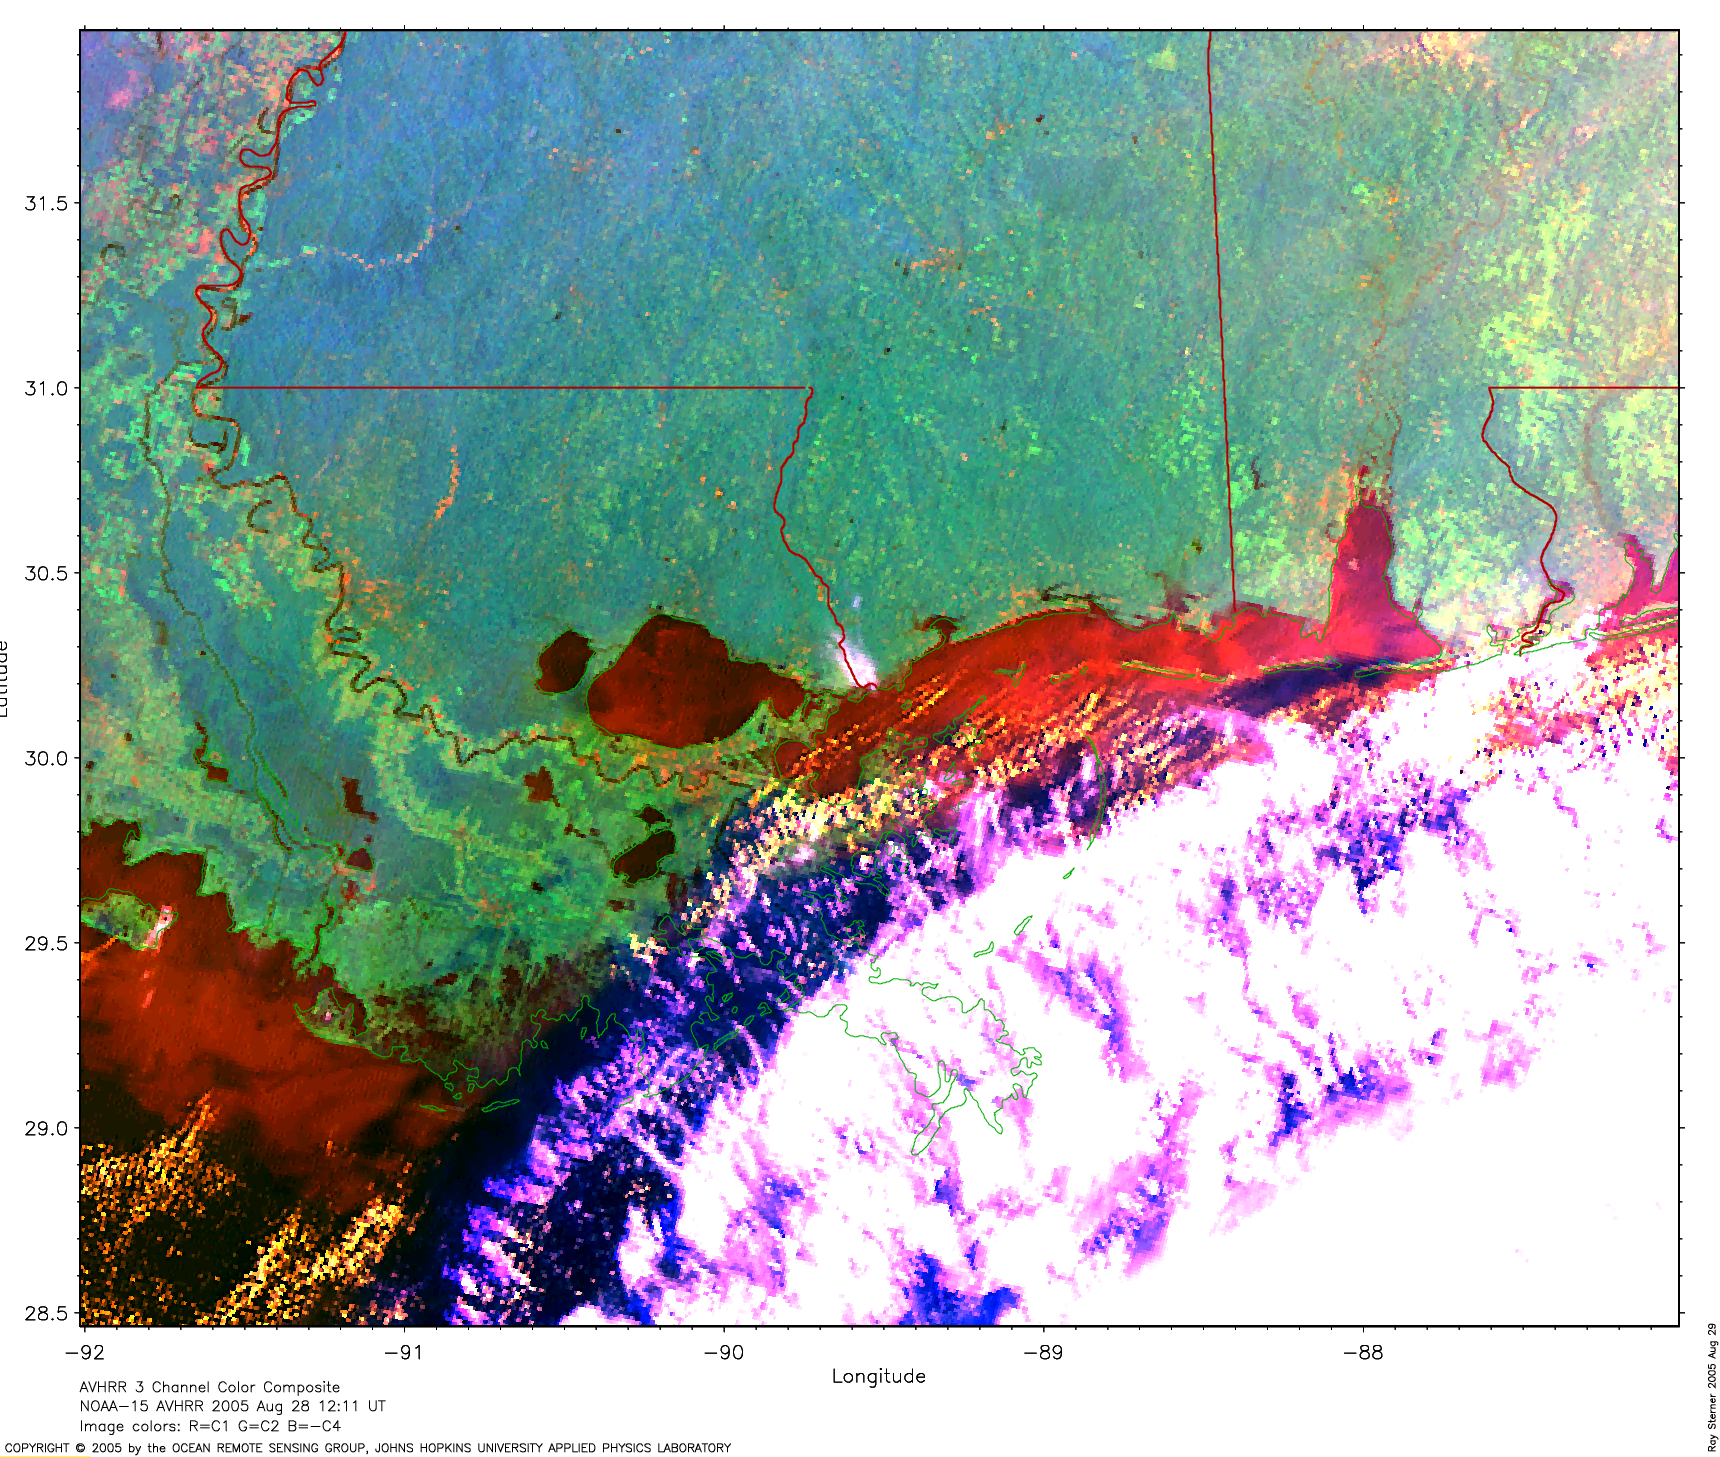
A larger view (1290 Kb)
of this image showing impact area before Katrina is available.
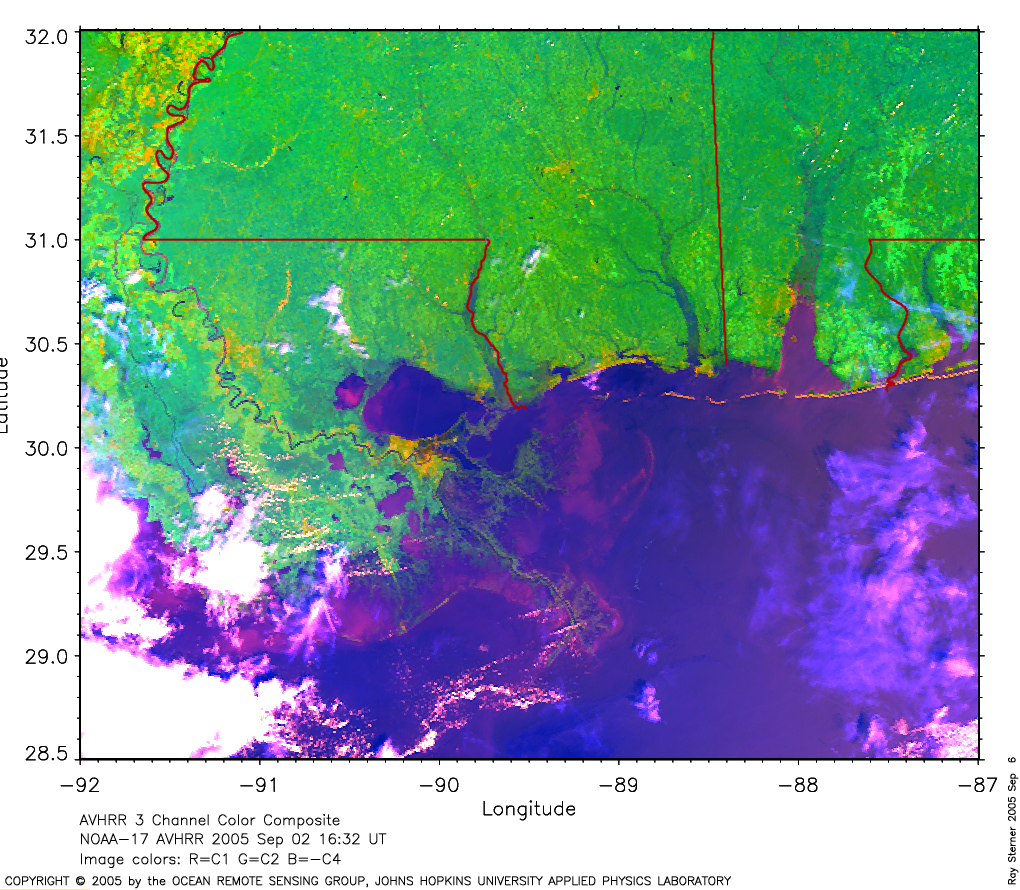
New Orleans 4 days after
Katrina (902 Kb) showing the flood waters.
A larger view (1633 Kb)
of this image showing impact area 4 days after Katrina is available.
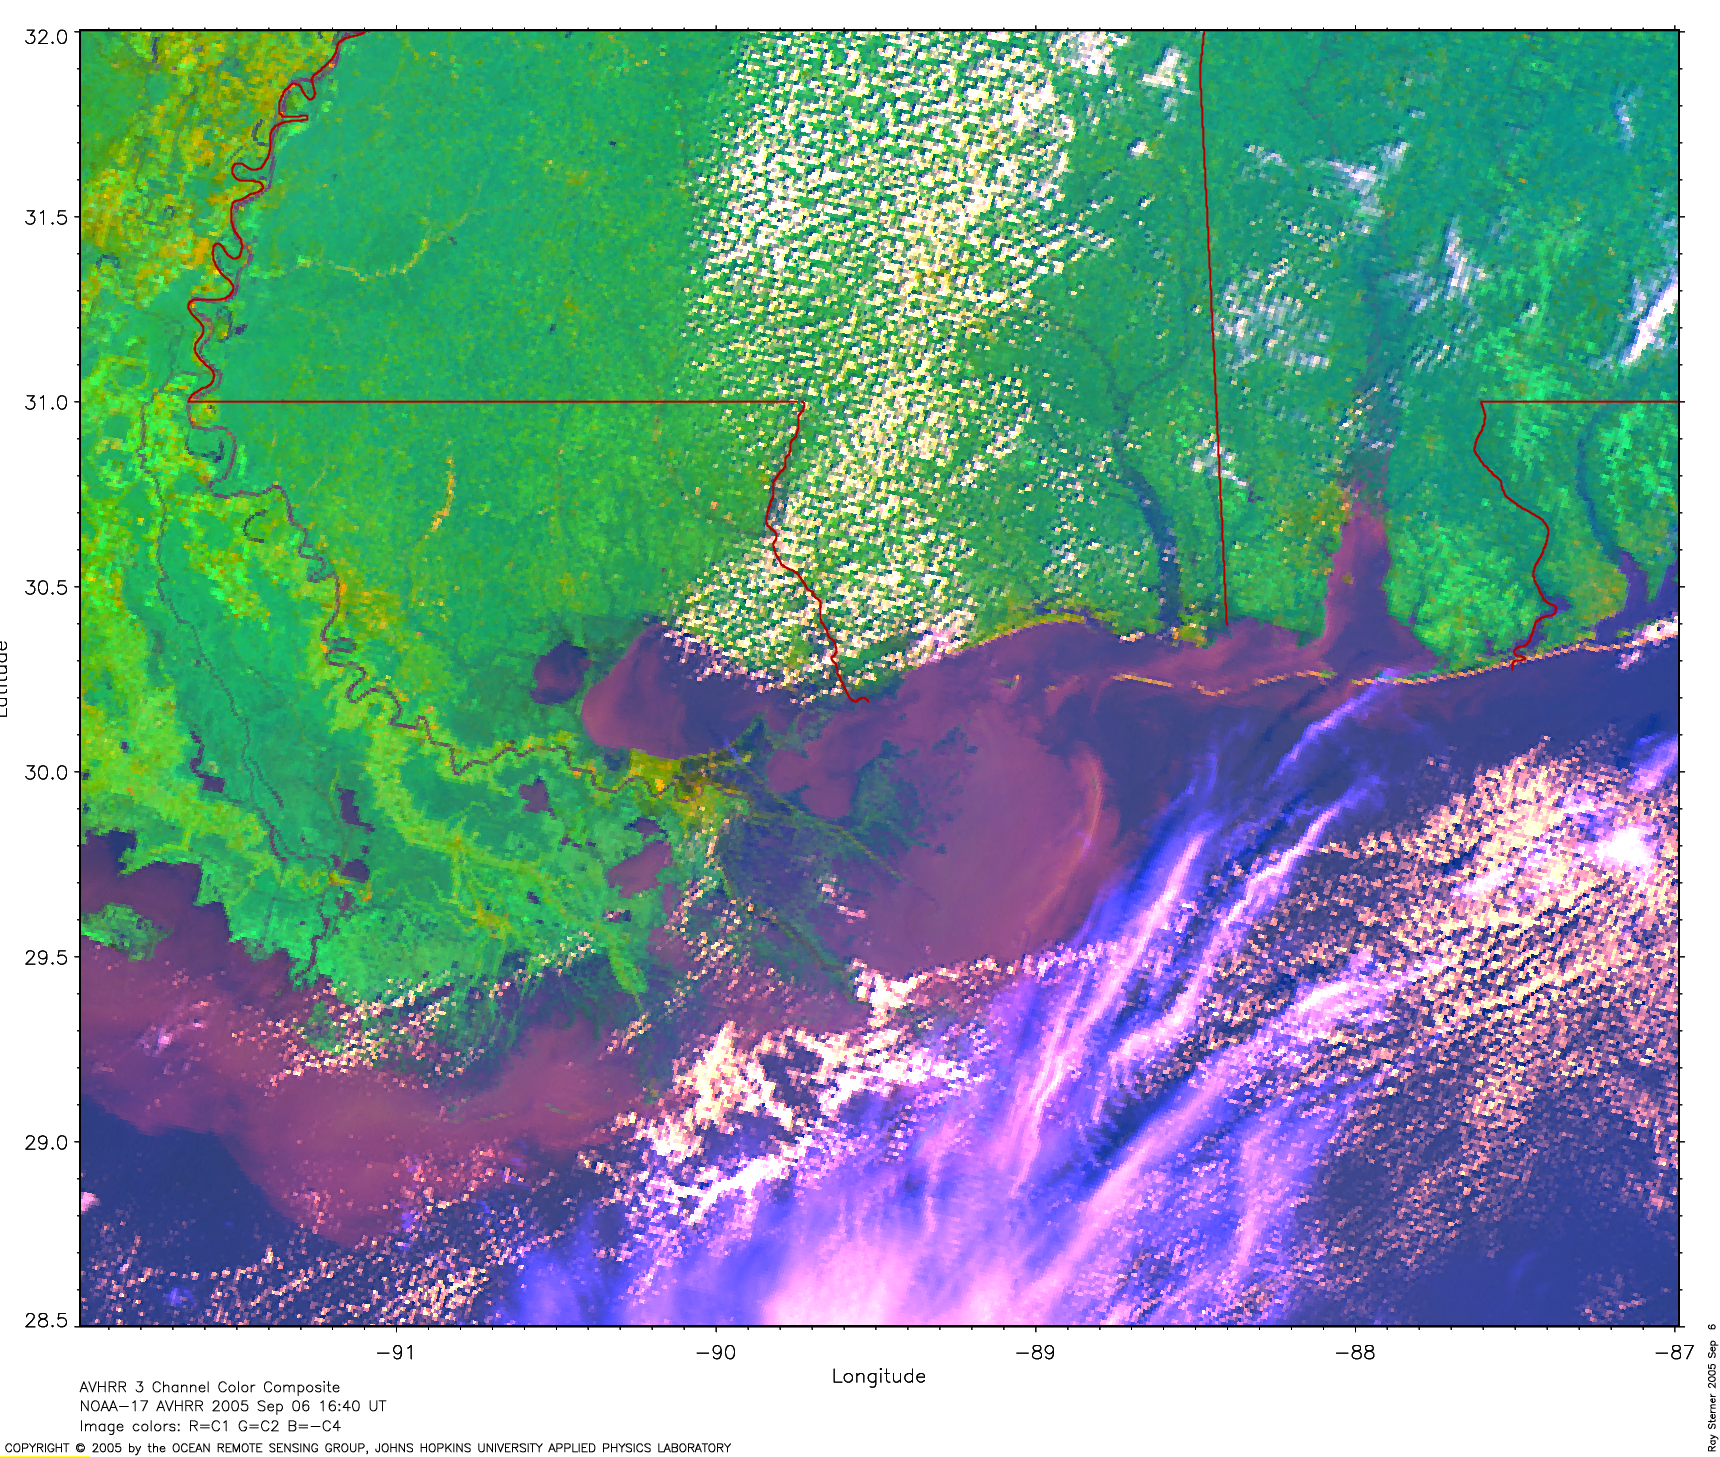
New Orleans 7 days after
Katrina (998 Kb) showing the flood waters.
A larger view (1816 Kb)
of this image showing impact area 7 days after Katrina is available.
(These images created by Ray Sterner)