A Multiscale Numerical Study of Hurricane Andrew (1992). Part II: Kinematics and Inner-Core Structures
Yubao Liu, Da-Lin Zhang and M.K. Yau
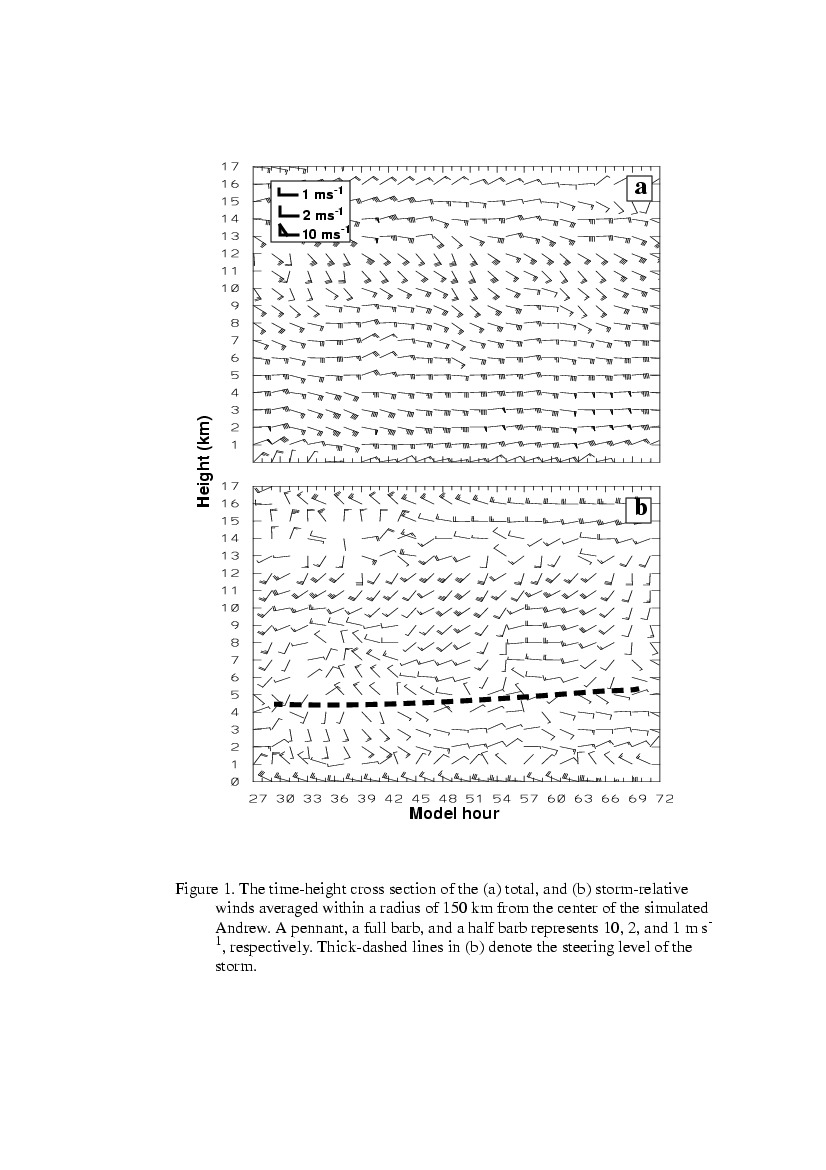
Figure 2. A comparison of (a) the hourly mean velocity (Vm, averaged from the profile given in Fig. 1 between 900 and 150 hPa) and the propagation velocity (Vs) and (b) their speeds (i.e., |Vs|, |Vm|) and differences (i.e., |Vs| - |Vm|) of the simulated Andrew. A full barb and a half barb in (a) represents 2, and 1 m s-1, respectively.
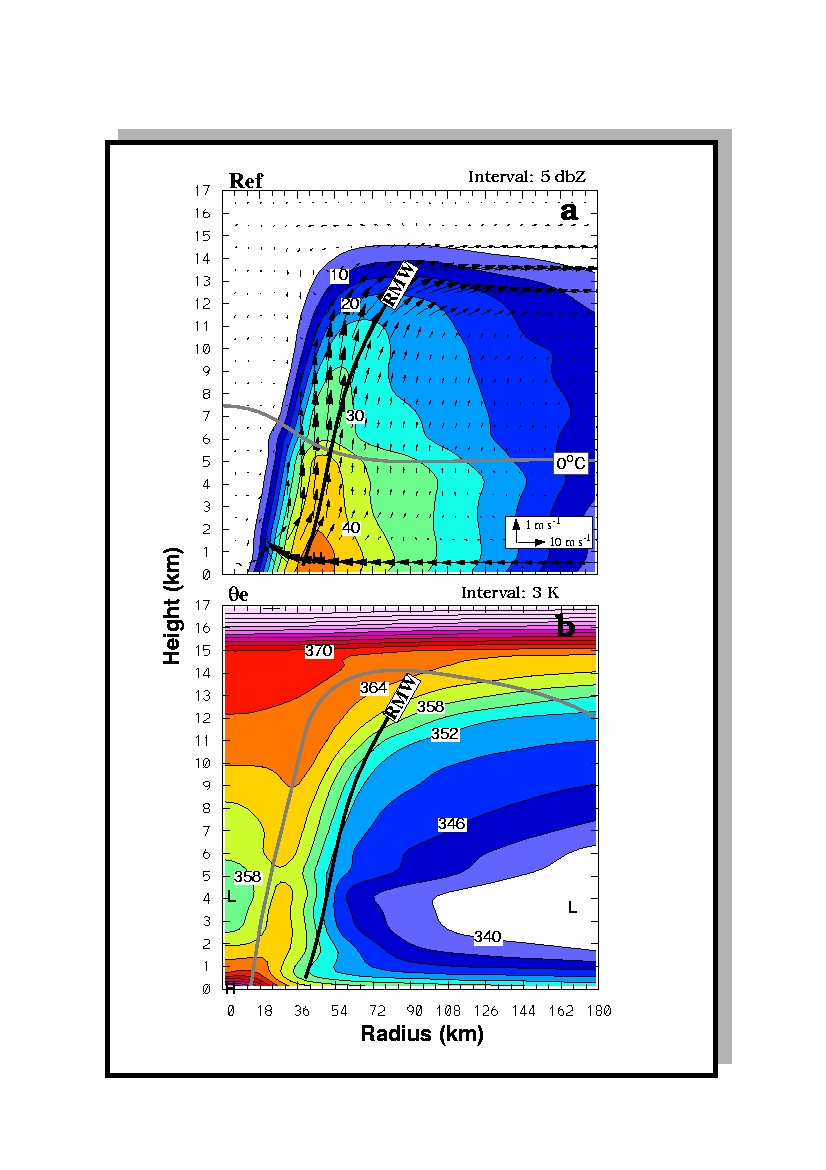
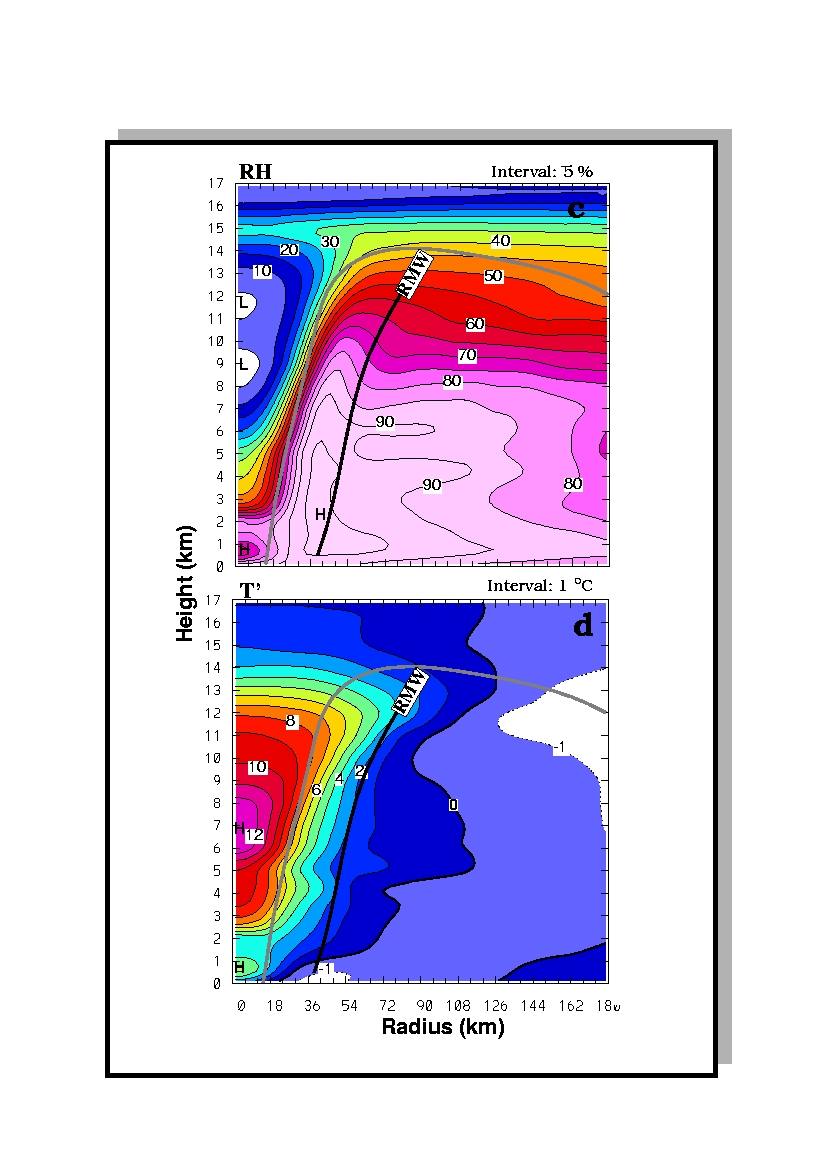
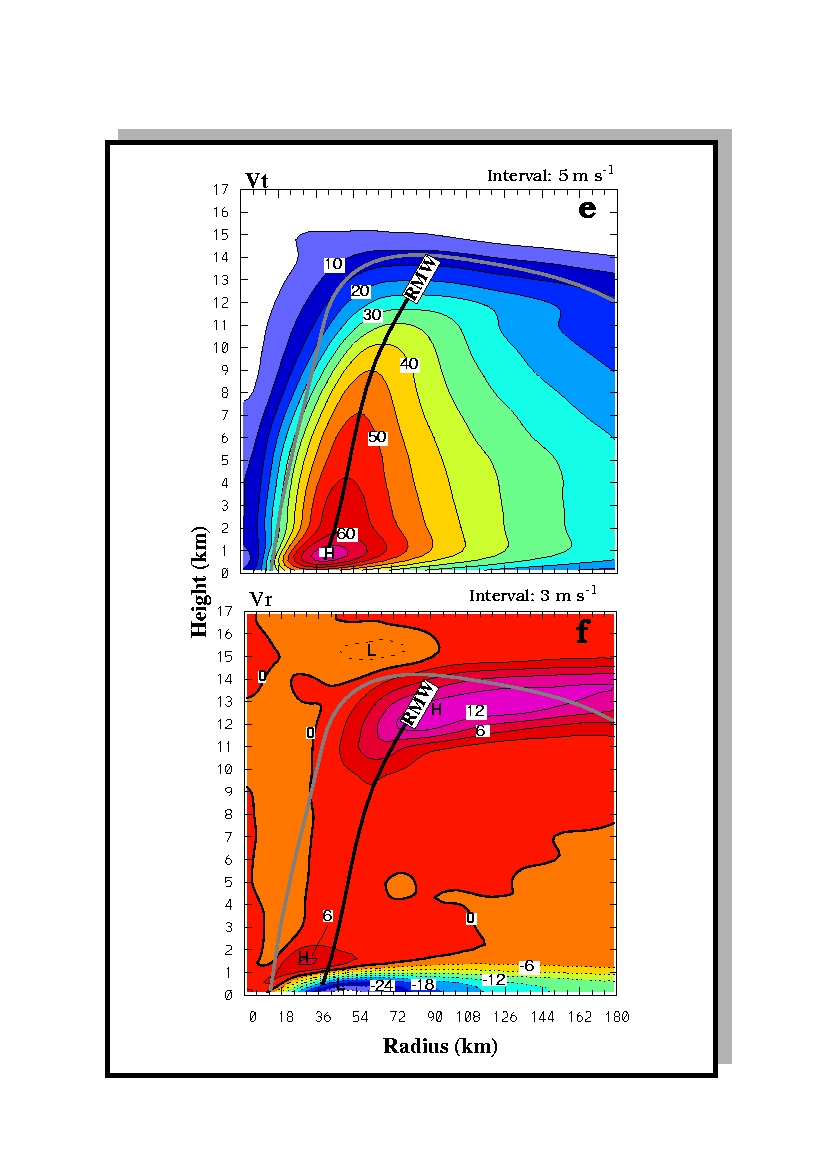
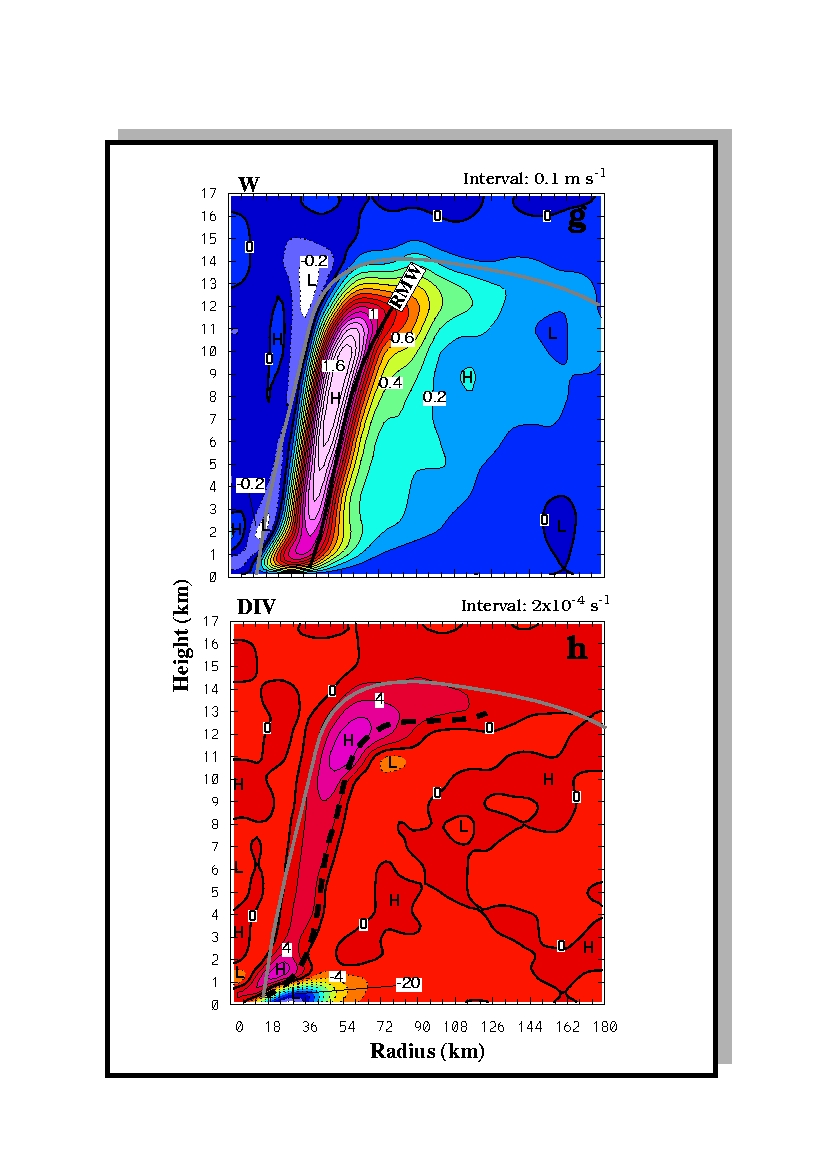
Figure 3 (color). Radius-height cross sections of azimuthally and temporally (from the 48 to 60 h integration) averaged fields: 3a and 3b) radar reflectivity (Ref, dBZ), superposed with cross-sectional flow vectors; (b) relative humidity (RH, %); 3c and 3d) equivalent potential temperature (q e, K); (d) temperature deviation (T, 0C); 3e and 3f) tangential winds (Vt, m s-1);(f) radial winds (Vr, m s-1); 3g and 3h) divergence (DIV, 10-4 s-1); and (h) vertical velocity (W, m s-1). Thick solid lines denote the distribution of 0 0C, the inner edge of the eyewall by the 10 dbZ contour and the RMW. Thick dashed lines in (g) is the axis of maximum updrafts from (h). Solid (dashed) lines represent positive (negative) values.
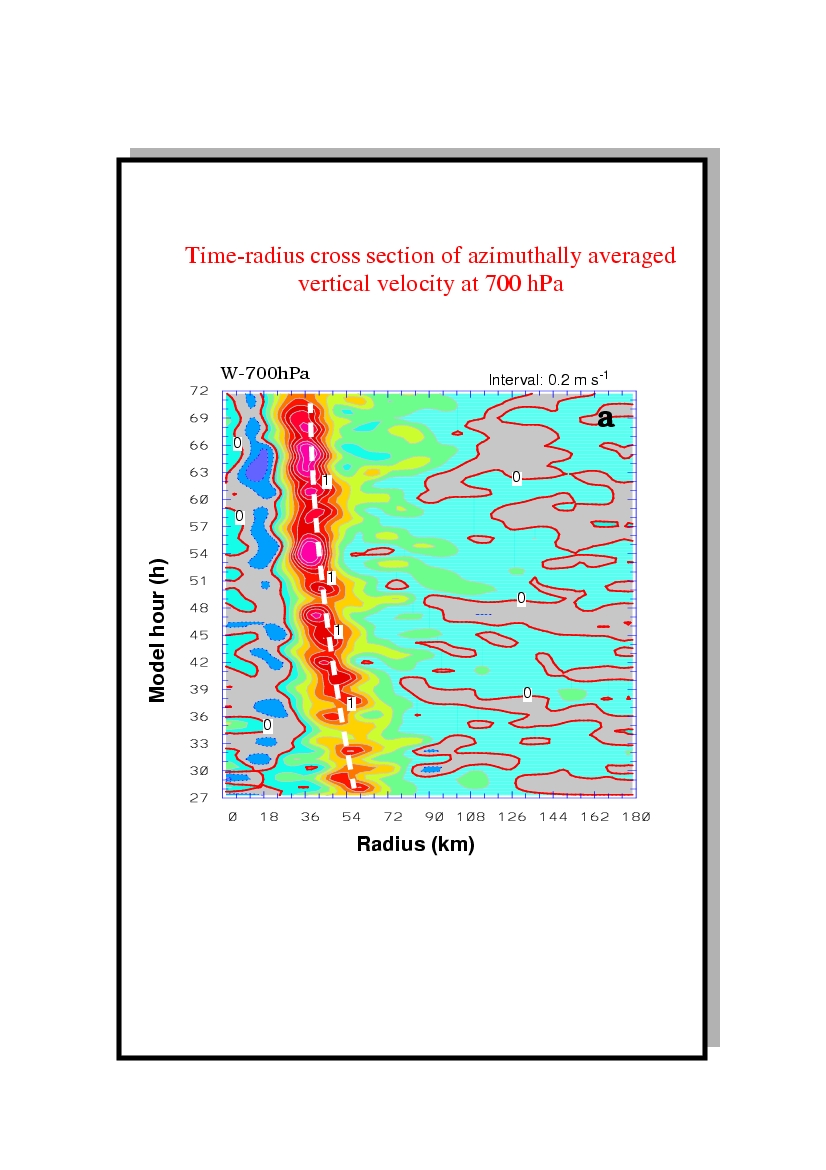
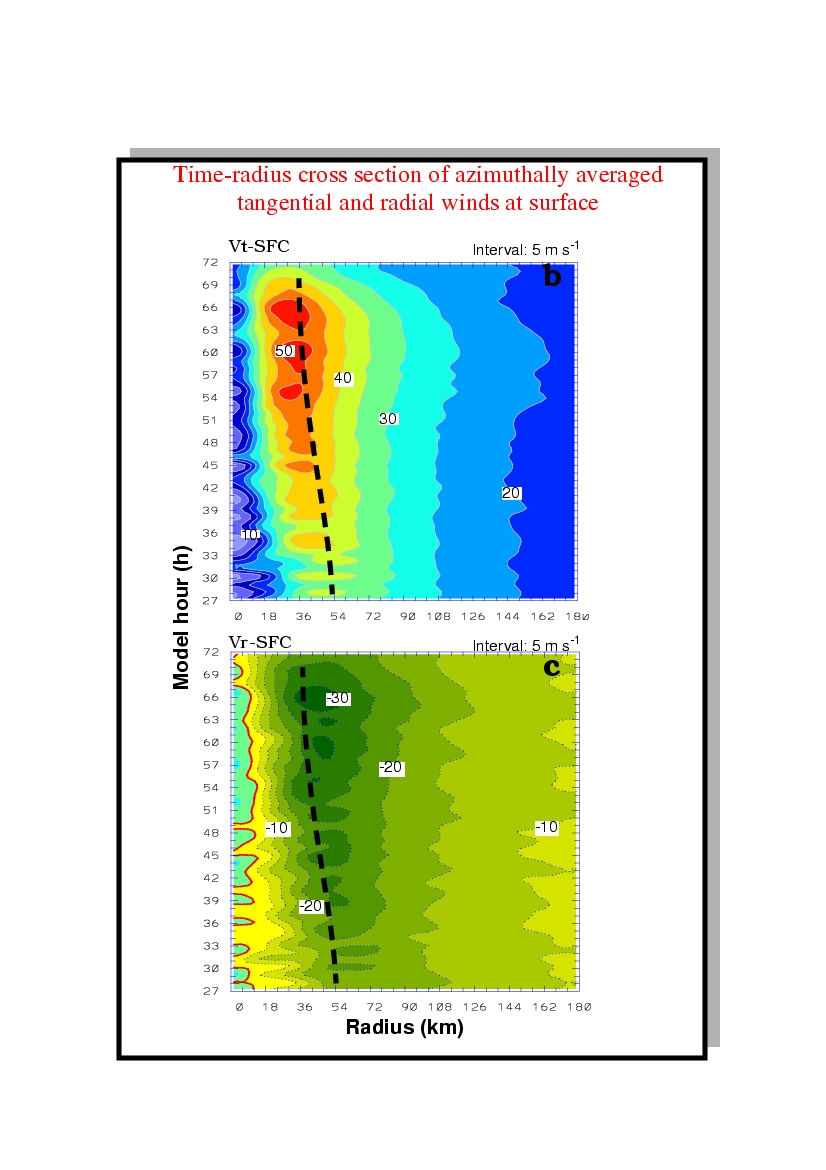
Figure 4 (color). The time-radius cross section of azimuthally averaged fields: (a) vertical motion at 700 hPa; (b) tangential and 4c) radial wind speeds at the surface (s = 0.995). The thick-dashed lines denote the RMW at 700 hPa (a) and the surface (b, c).
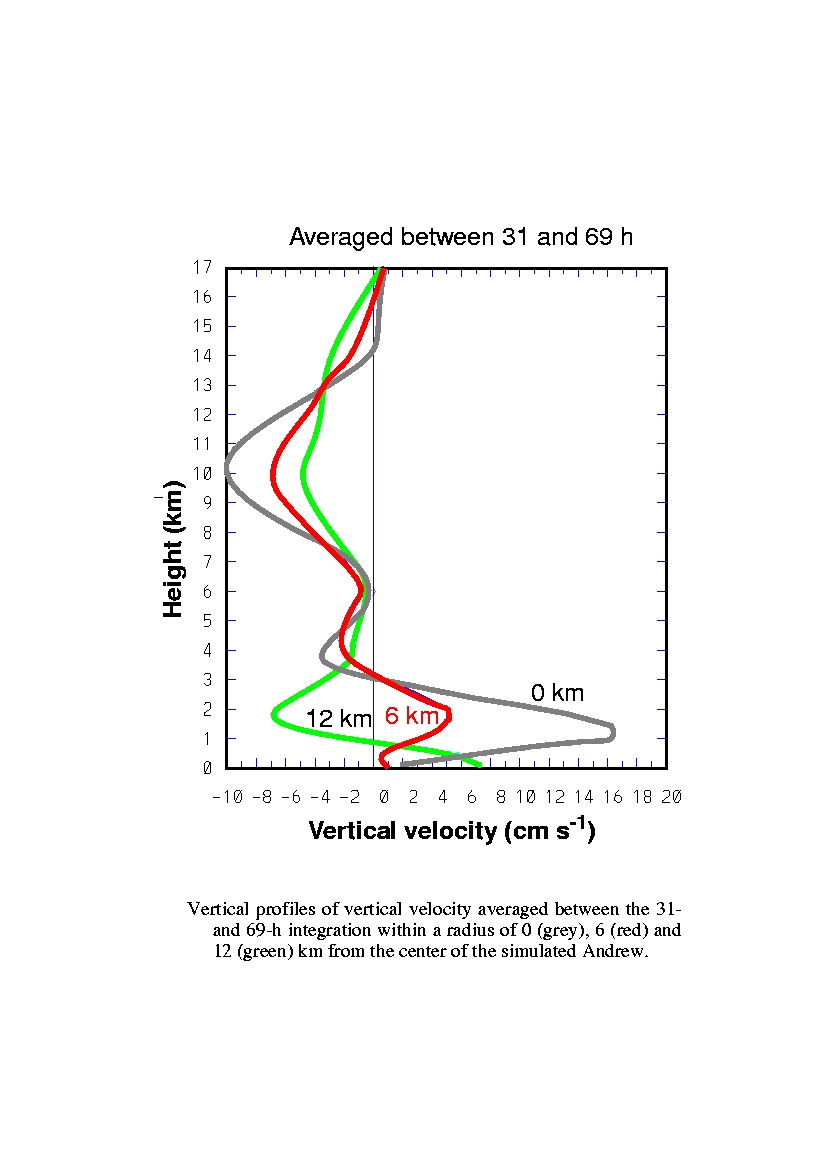
Figure 5 (color). Vertical profiles of vertical velocity averaged between the 31- and 69-h integration within a radius of 0 (dashed), 6 (solid) and 12 (dotted) km from the center of the simulated Andrew.
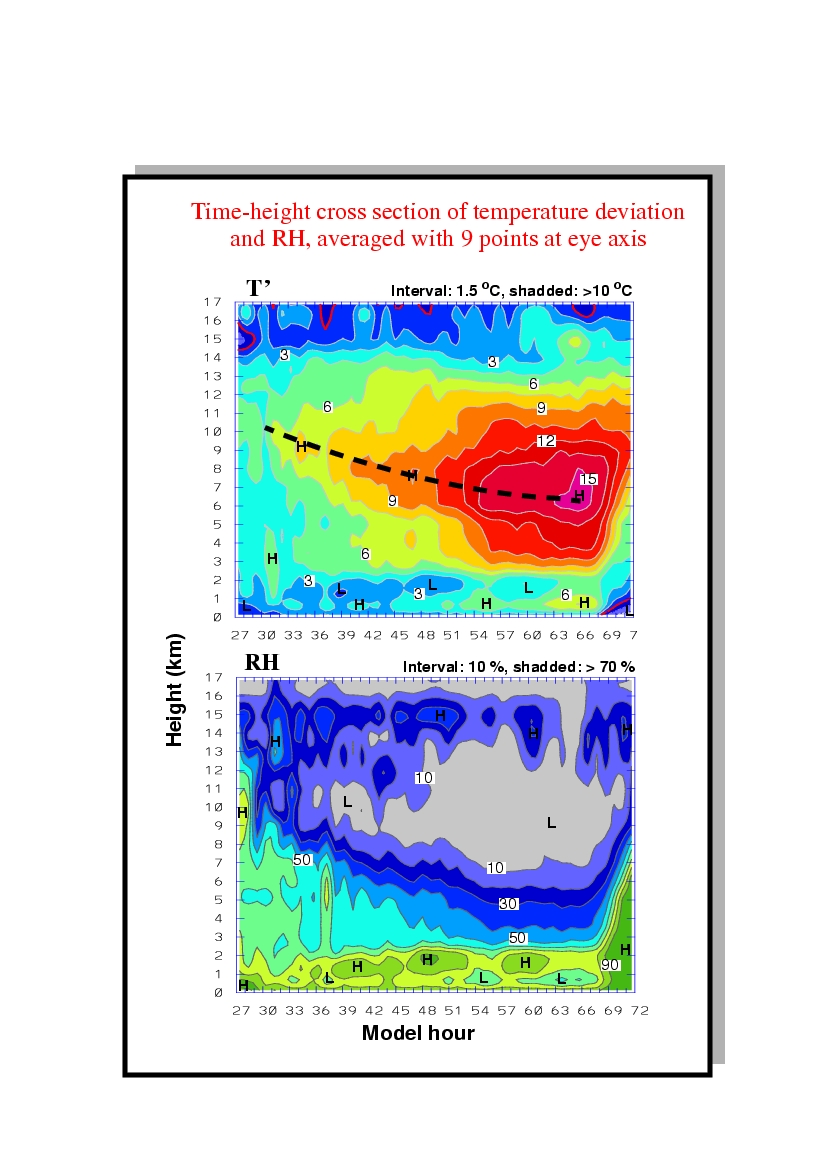
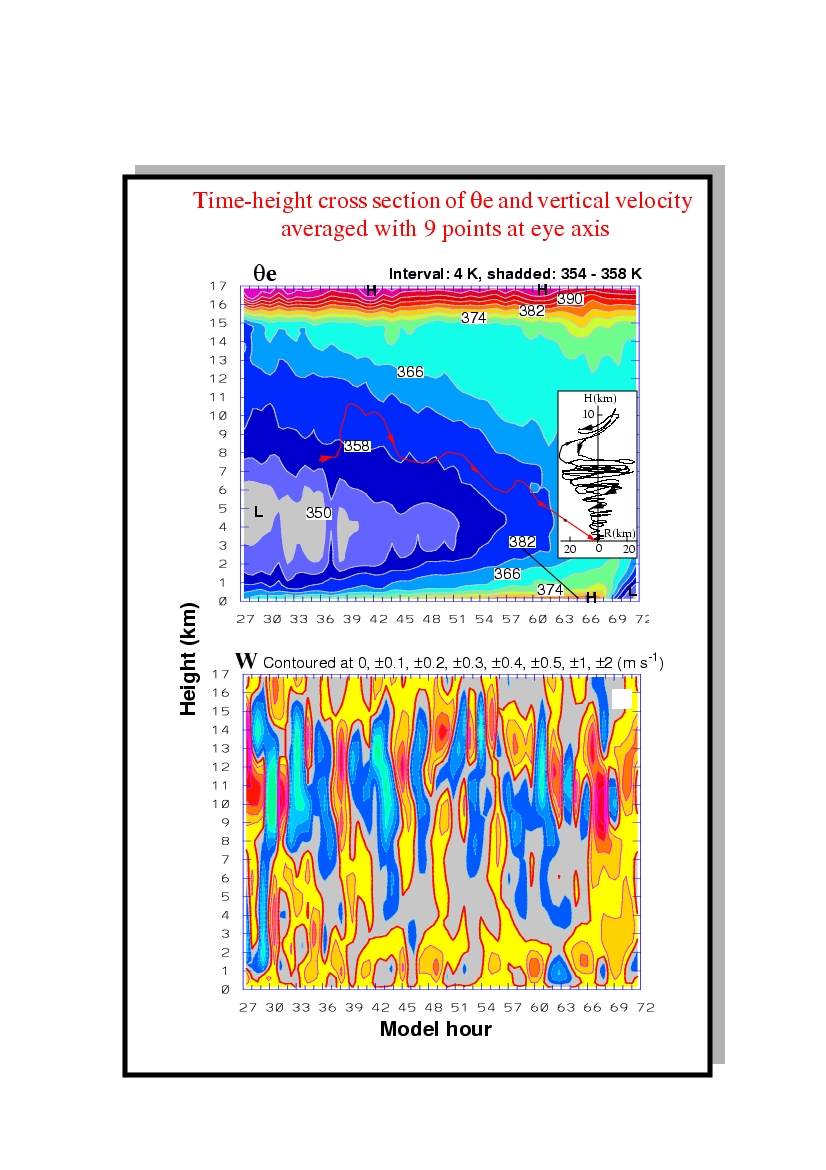
Figure 6 (color). The time-height cross section for (a) temperature deviation (T, 0 0C); (b) relative humidity (RH, %); and (c). equivalent potential temperature (q e, K) averaged with 9 points (18 x 18 km2) centered in the eye. Superposed on (c) is a backward trajectory (thick solid lines) of an air parcel in the eye, which starts at 3.2 km/68 h backing to 7.5 km/36 h. An inset of the trajectory is also given in (c).
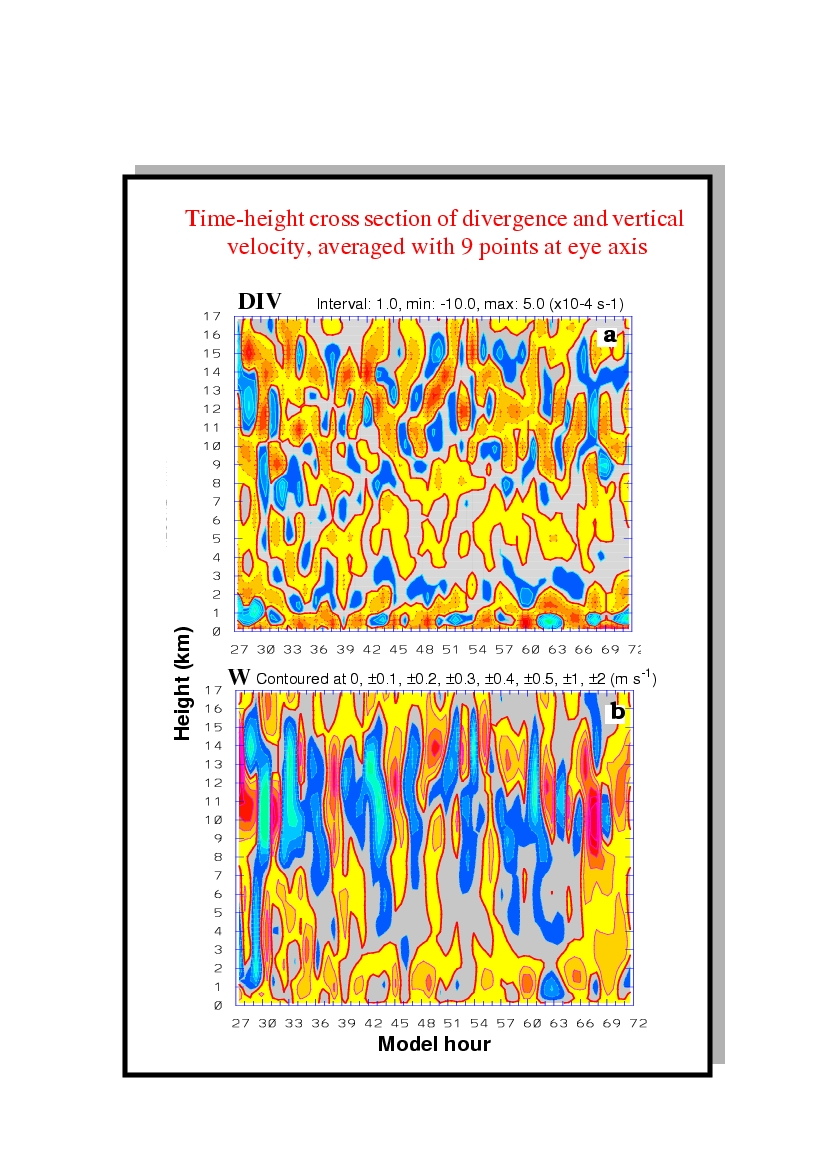
Figure 7 (color). As in Fig. 6 but for vertical velocity (W, m s-1). Upward motion is shaded.
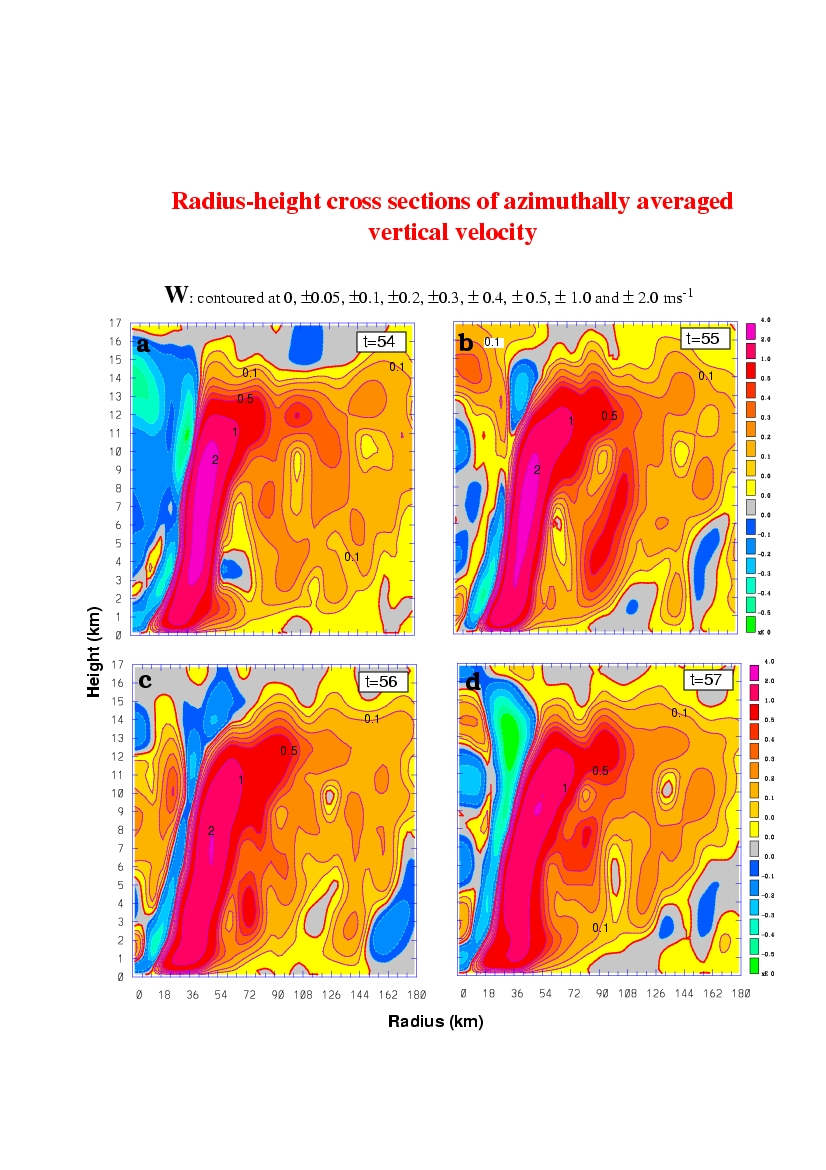
Figure 8 (color). Radial-height cross sections of azimuthally averaged vertical velocity with contours at 0, (± ) 0.05, (± ) 0.1, (± ) 0.2, (± ) 0.3, (± ) 0.4, (± ) 0.5, (± ) 1.0 and (± ) 2.0 m s-1 from (a) 54-; (b) 55-; (c) 56-; and (d) 57-h integration. Solid (dashed) lines are for upward (downward) motions.
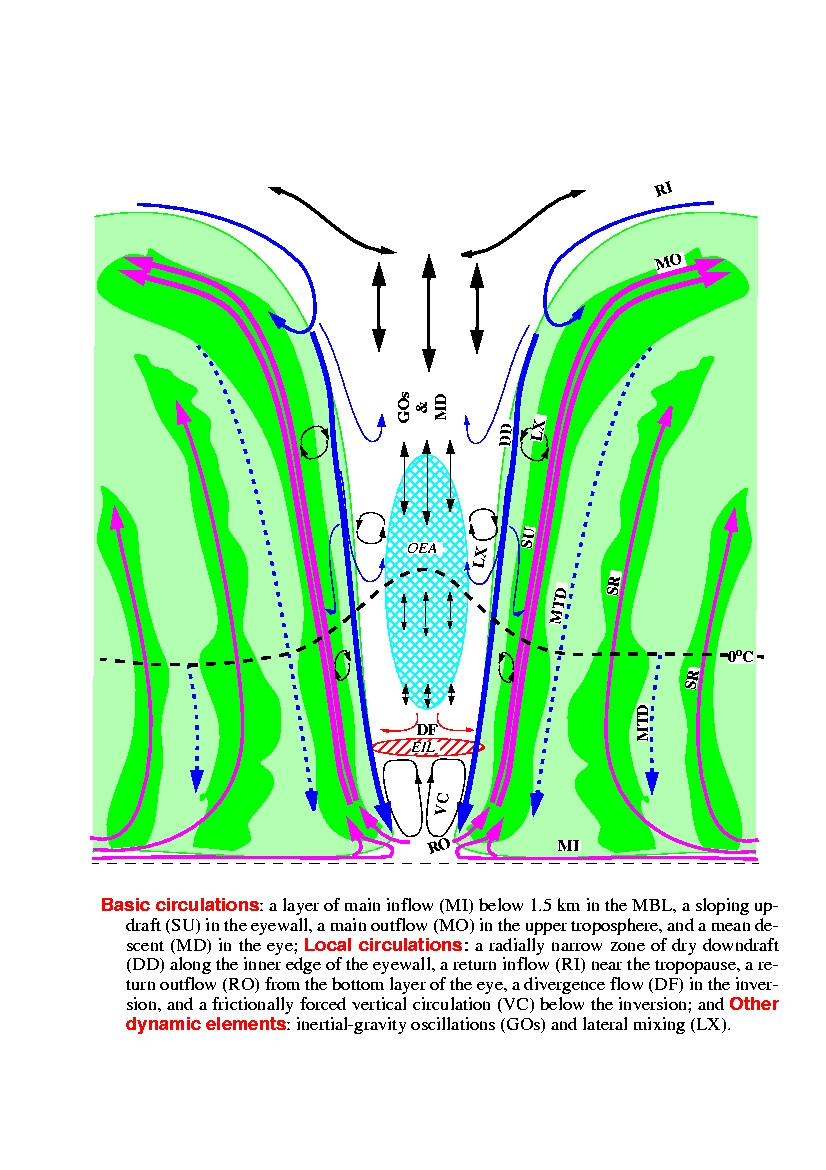
Figure 9 (color). A schematic (radial-height) conceptual model of a mature hurricane in the inner core region. The light-shading areas indicate regions with cloud and precipitation. The dark regions represent the convective eyewall and spiral rainbands. The slash-hatched areas represents the eye inversion layer (EIL) and the cross-hatched regions is the occluded eye air (OEA) with low qe. The freezing level is marked with a dashed line. MTD and SR stand for moist downdrafts between the convective bands and spiral rainband updrafts, respectively. Refer to the text for the meaning of other symbols.
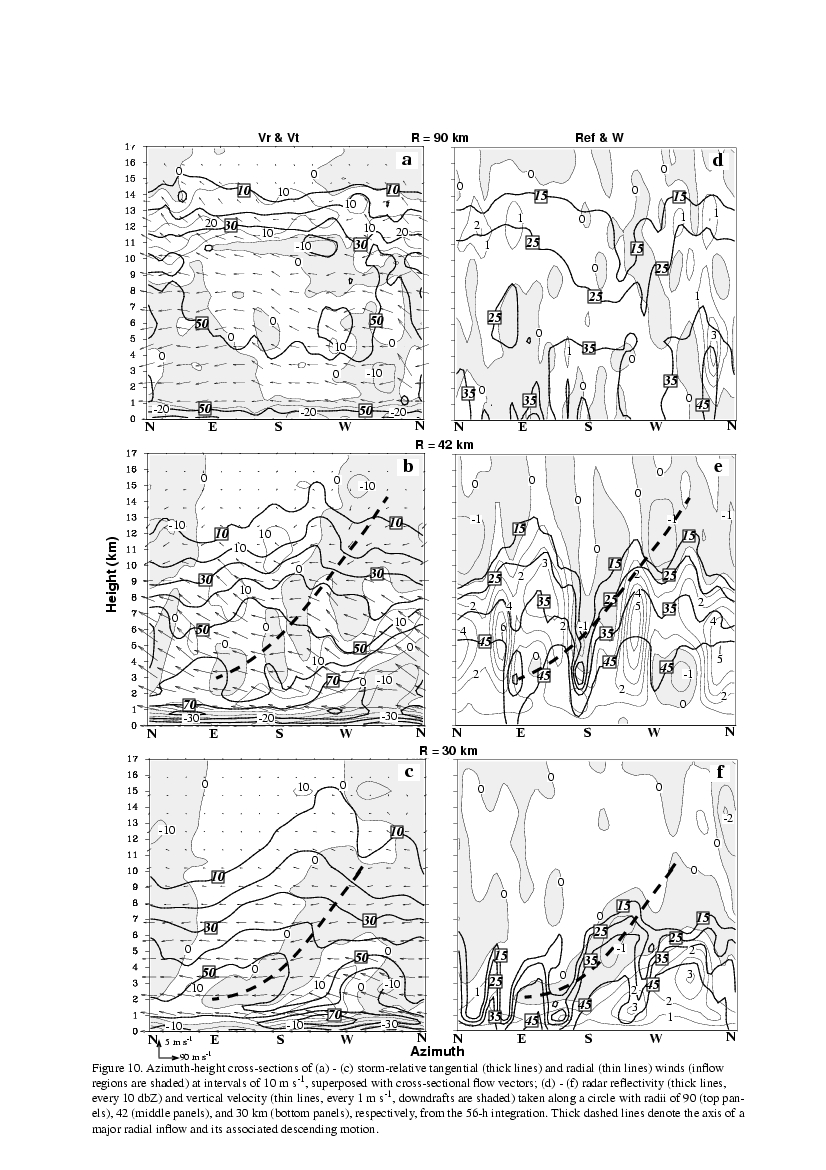
Figure 10. Azimuth-height cross-sections of (a) - (c) storm-relative tangential (thick lines) and radial (thin lines) winds (inflow regions are shaded) at intervals of 10 m s-1, superposed with cross-sectional flow vectors; (d) - (f) radar reflectivity (thick lines, every 10 dbZ) and vertical velocity (thin lines, every 1 m s-1, downdrafts are shaded) taken along a circle with radii of 90 (top panels), 42 (middle panels), and 30 km (bottom panels), respectively, from the 56-h integration. Thick dashed lines denote the axis of a major radial inflow and its associated descending motion.
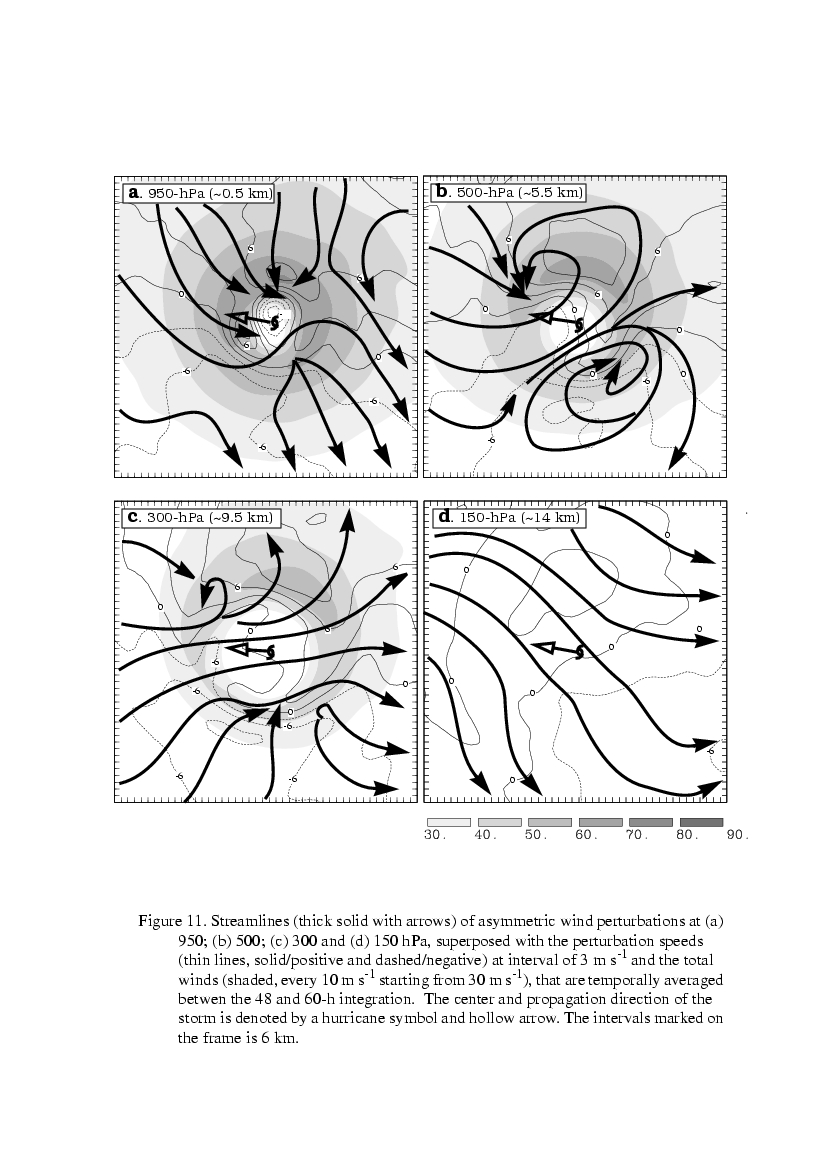
Figure 11. Streamlines (thick solid with arrows) of asymmetric wind perturbations at (a) 950; (b) 500; (c) 300 and (d) 150 hPa, superposed with the perturbation speeds (thin lines, solid/positive and dashed/negative) at interval of 3 m s-1 and the total winds (shaded, every 10 m s-1 starting from 30 m s-1), that are temporally averaged between the 48 and 60-h integration. The center and propagation direction of the storm is denoted by a hurricane symbol and hollow arrow. The intervals marked on the frame is 6 km.