Contrasting events in 1988 and 1993
(Poster presentation for the 8th Annual CCSM Workshop)
1. Introduction. Interannual variability of stationary moisture fluxes over North America from the Community Atmosphere Model (CAM) and the NASA Seasonal-to-Interannual Precipitation Project (NSIPP) Model are compared. Moisture fluxes into the United States are dominated by those coming from the Gulf of Mexico on annual basis, but their modulation at larger time scales are linked to extreme events and this is the focus in the present study.
2. Data. Reanalyses data sets from NCEP and ECMWF are used as targets for AMIP runs from the CAM and NSIPP models for the 1979-1993 period. In addition the Xie/Arkin precipitation data set is used too. Data sets are on a 5x2.5 grid, except by the Hulme data set that is on a 3.75x2.5 grid. Reanalyses and simulation data sets are on pressure levels at 1000, 925, 850, 700, 600, 500, 400 and 300 mb. Monthly anomalies are calculated with respect to the 1979-1993 climatology.
3. Results. Observed and simulated summer hydrology is assessed in three ways, 1) through their climatology, standard deviation, and extreme events, 2) through the creation of a precipitation index, and 3) through a multivariate analysis.
3a.
Climatology, standard deviation, and the 1988 and 1993 extreme events.
There are identifiable features in the summer climatology of stationary moisture fluxes that both models reproduce with some evident problems.
|
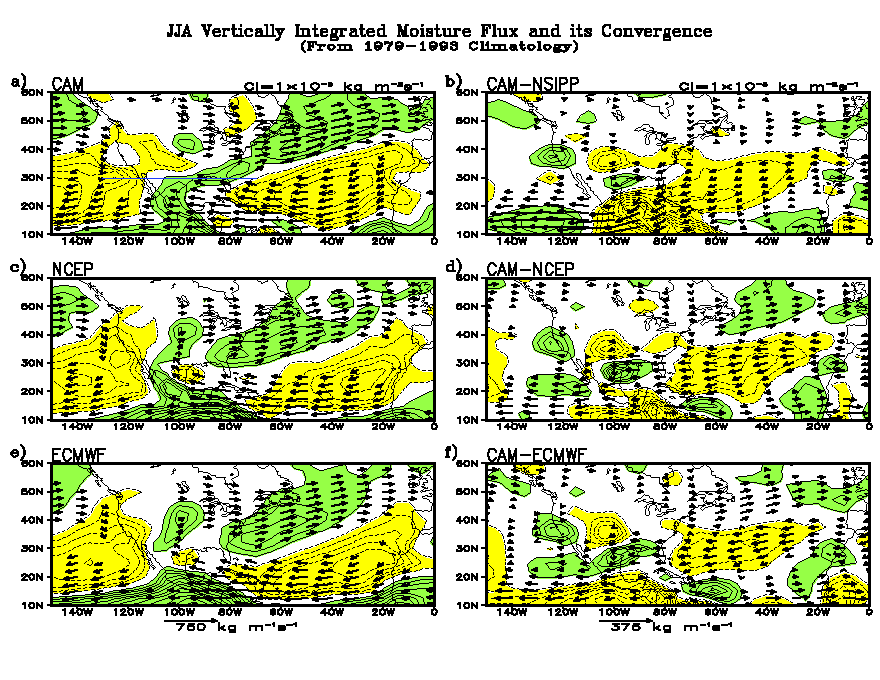
June-July-August Vertically Integrated stationary moisture fluxes (f1) |
June-July-August meridional stationary moisture flux at 30N (f2) |
|
ü Reasonable simulation of large-scale moisture fluxes over the US by both models. ü Deficient simulation over the subtropics in both models: Weaker (excessive) moisture flux convergence in CAM than in NSIPP and reanalysis as well as over Central America, western Caribbean, and southern Gulf of Mexico (western Gulf of Mexico) |
ü CAM low-level-jet is weaker than the observed jet but stronger than in NSIPP simulation. |
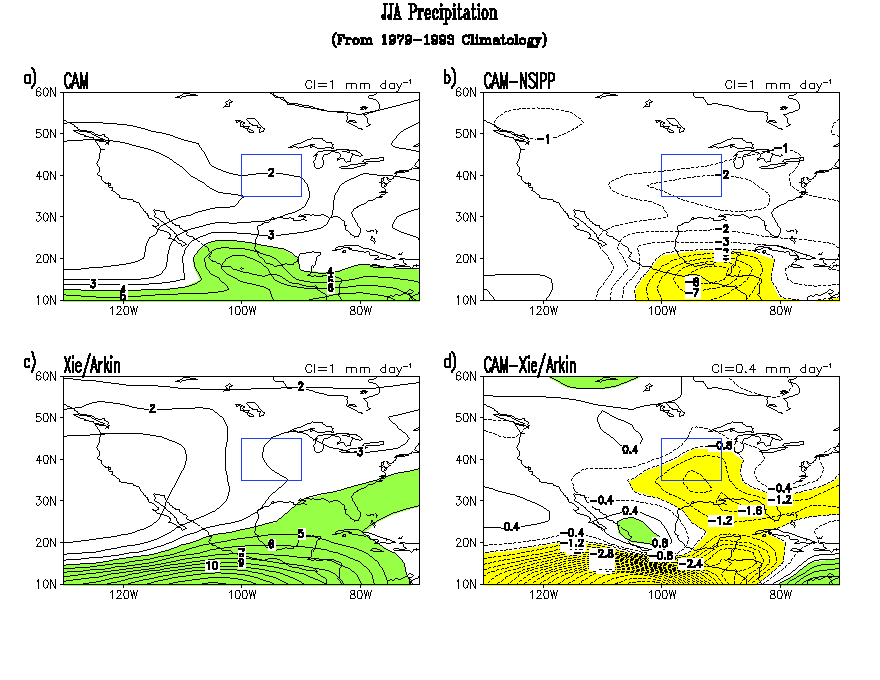
Precipitation and its variability, in spite of
some differences, are reasonable simulated by both models:
|
Weaker summer precipitation in CAM than in NSIPP simulation, and observed over Central America, western Caribbean, southern Gulf of Mexico, and central US |
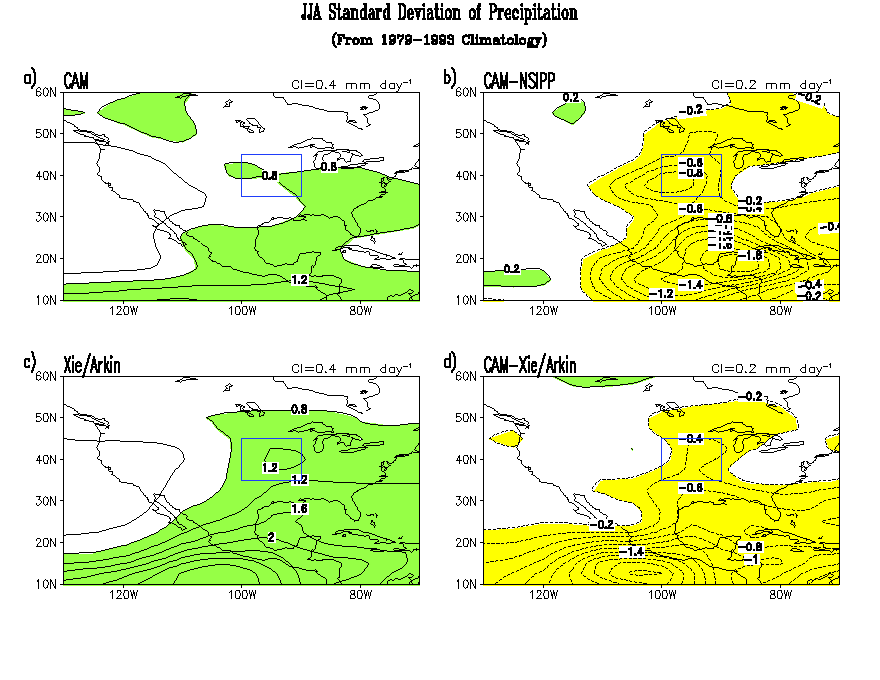
Standard Deviation of precipitation is smaller
in CAM than in NSIPP simulation and observations: ü Smaller ITCZ variability in CAM than in observations ü Smaller variability over central US ü Variability in NSIPP simulation is closer to observations than variability in CAM simulation over central US. |
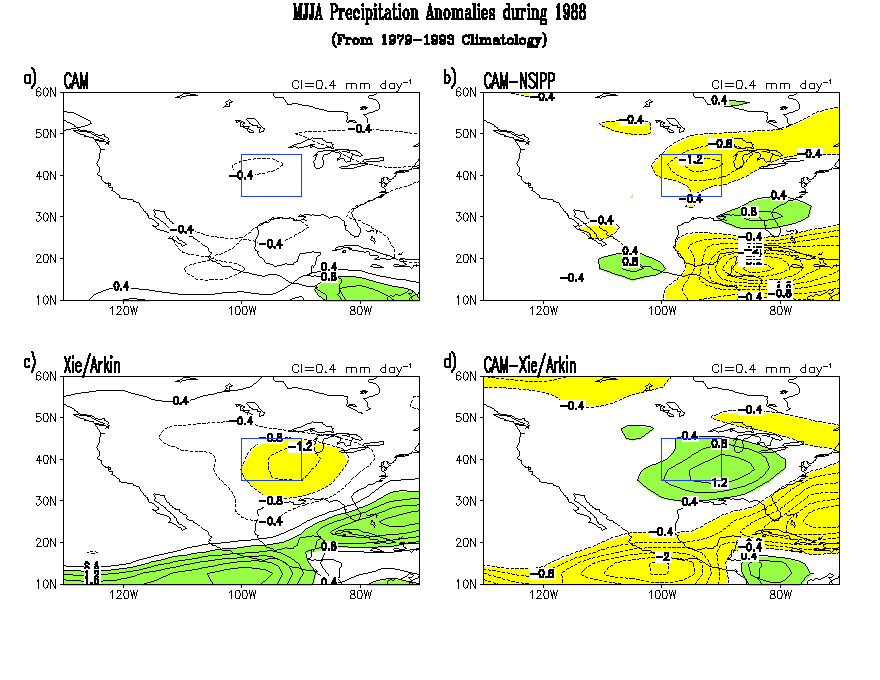
Particular attention to the 1988 drought and
1993 flood events over central US displays some differences between the models:
|
Drought conditions over central US from May to August 1988 (f5) |
Wet conditions over central US from May to August 1993. (f6) |
|
ü CAM simulation underestimates drought conditions over central US ü CAM simulation overestimates the ITCZ over eastern Pacific ü CAM simulation compares better to the observed anomalies than the NSIPP simulation over central US |
ü CAM simulation underestimates wet conditions over central US ü CAM simulation does not get the observed wet conditions over eastern Pacific ü CAM simulation has larger positive anomalies than NSIPP simulation over southeast US but smaller over central US. |
|
·
Differences between CAM
and NSIPP simulations over the Caribbean
Sea and Gulf of Mexico are mostly due to a known
bias in the NSIPP model producing a stronger than normal, and bad placed, eastern Pacific ITCZ. |
|
3b.
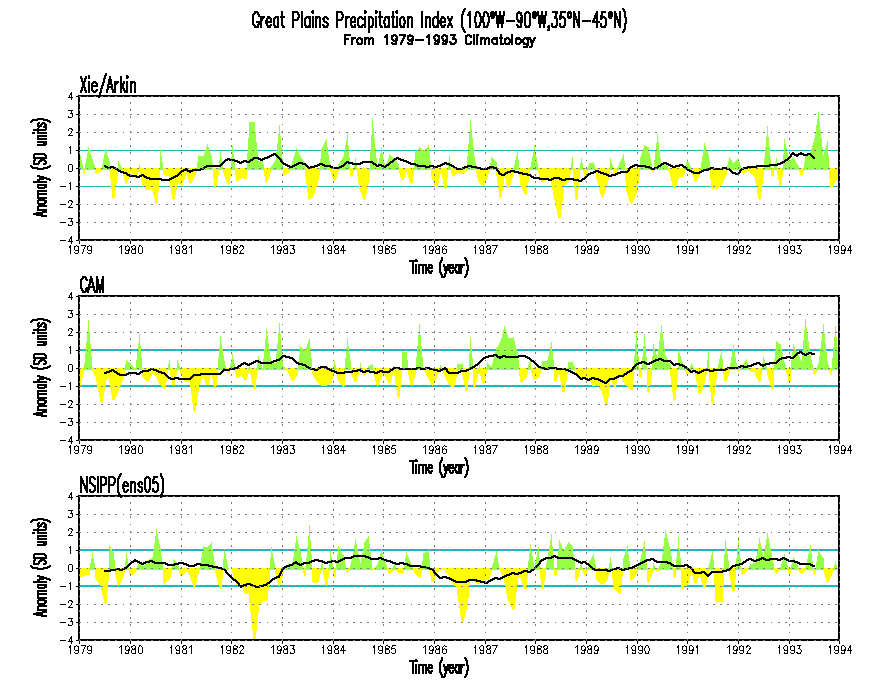
A Great Plains Precipitation Index.
A better view of the performance of the models over the central US (i.e. the Great Plains region) can be obtained through a precipitation index of the region (f7) for the 1979-1993 period:
Correlation between the time series shows:
v Low correlation between simulated and observed indices from May to August:
Ø CAM: mean MJJA correlation = 0.10
Ø NSIPP: mean MJJA correlation =-0.18
v High correlation between simulated and observed indices on another season's month:
Ø CAM: September correlation = 0.6
Ø NSIPP: February correlation = 0.7
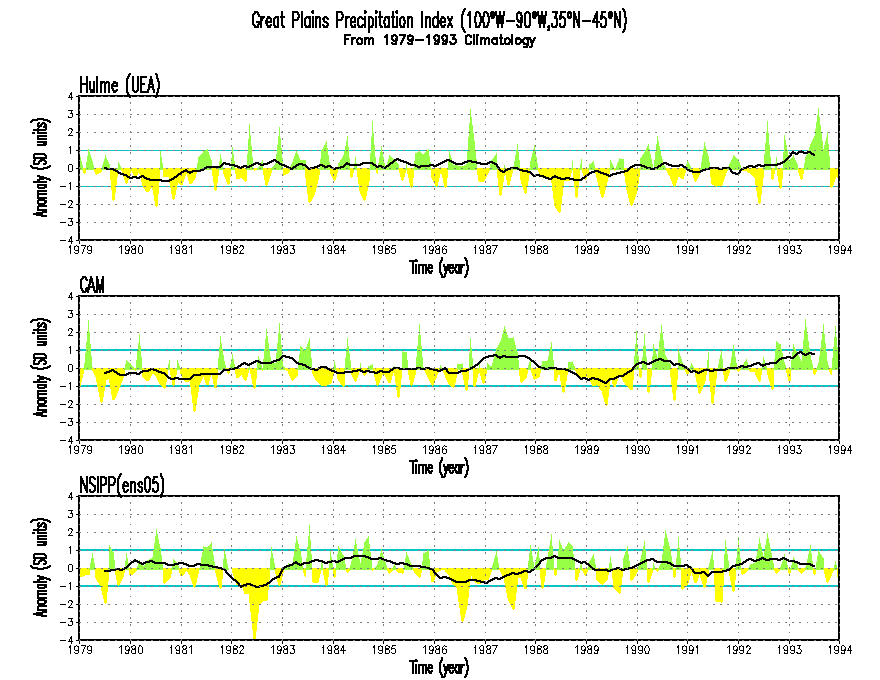
Correlations when the observed index comes from Hulme's data set (f8) are very similar to those shown before but decrease when the period is increased to 1950-1998.
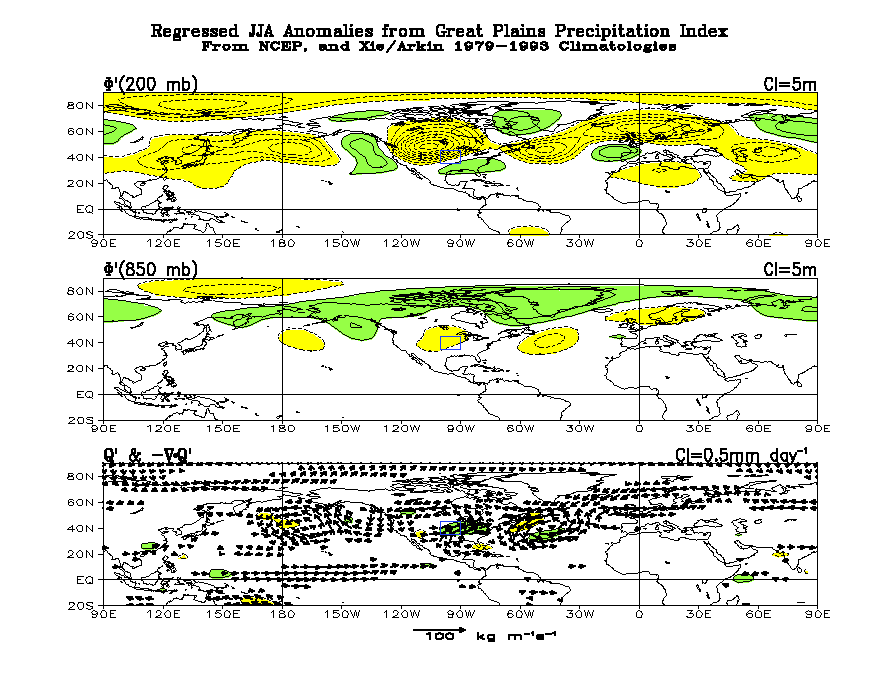
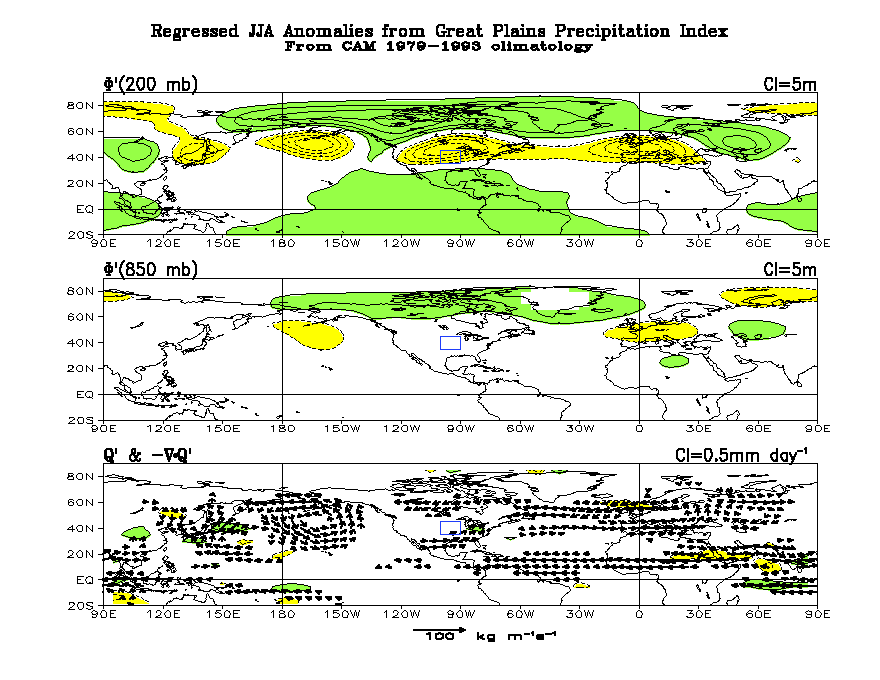
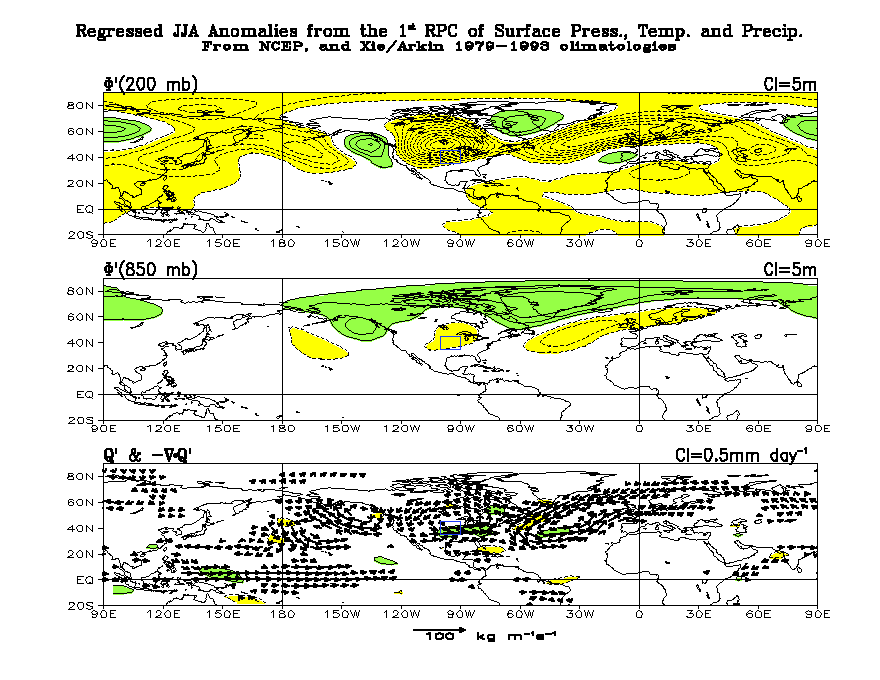
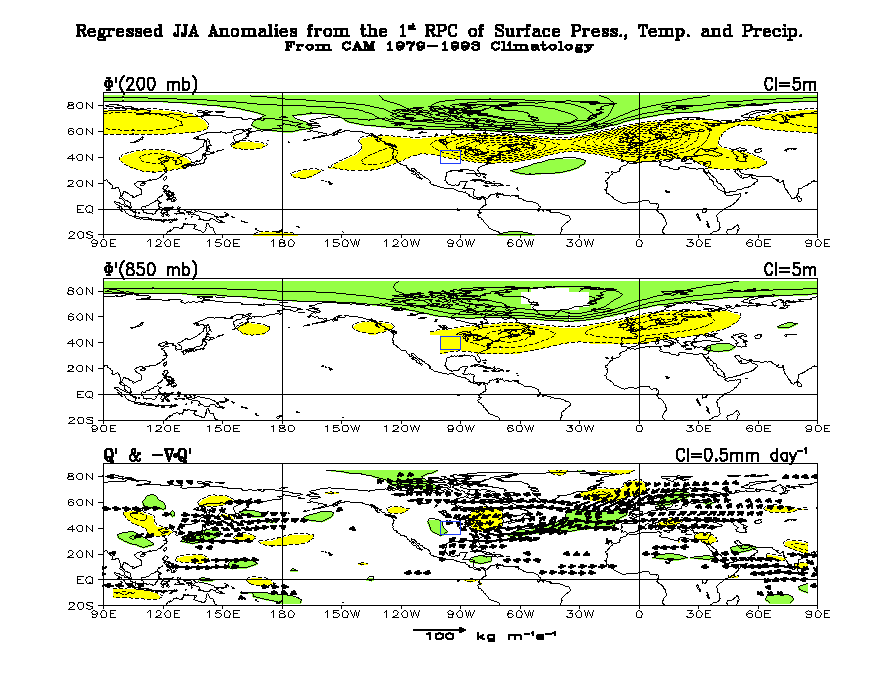
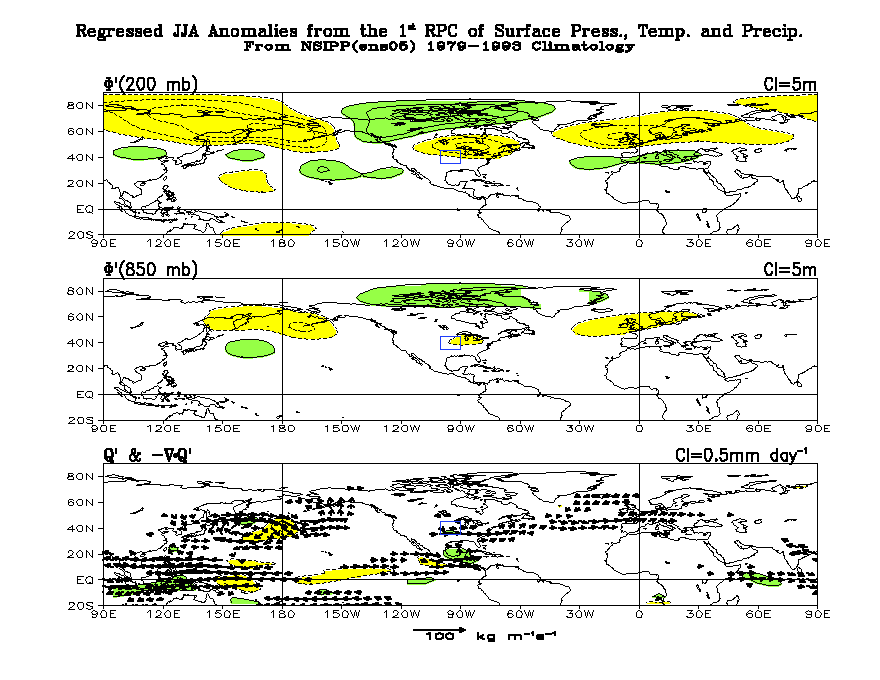
Regression on geopotential heights and vertically integrated moisture fluxes illustrate the dynamics of observations and simulations:
|
Observed conditions (f9) |
CAM simulation (f10) |
NSIPP simulation. (f11) |
|
ü Barotropic conditions with a deep low at upper levels over central US flanked by weak but defined anticyclones, one off the west coast and another over the southeast. ü A couplet of VIMFD/VIMFC over the Gulf of Mexico/Great Plains. ü Southerly moisture flux from the Gulf of Mexico toward the Great Plains. |
ü Barotropic conditions with a low at upper levels over central US and not well defined companion anticyclones. In addition, a height dome appears over most of the eastern tropical Pacific and adjacent American continent. ü No VIMFD/VIMFC couplet over the Gulf of Mexico/Great Plains. ü No southerly moisture flux from the Gulf of Mexico toward the Great Plains. |
ü Barotropic conditions with weak upper level cyclone over northwest US and stronger anticyclones, one well off the west coast and the other over the east. ü VIMFC regions over both Gulf of Mexico/Central America and the Great Plains. ü Southerly moisture flux from the Gulf of Mexico toward the Great Plains. |
3c.
A Rotated EOF Analysis.
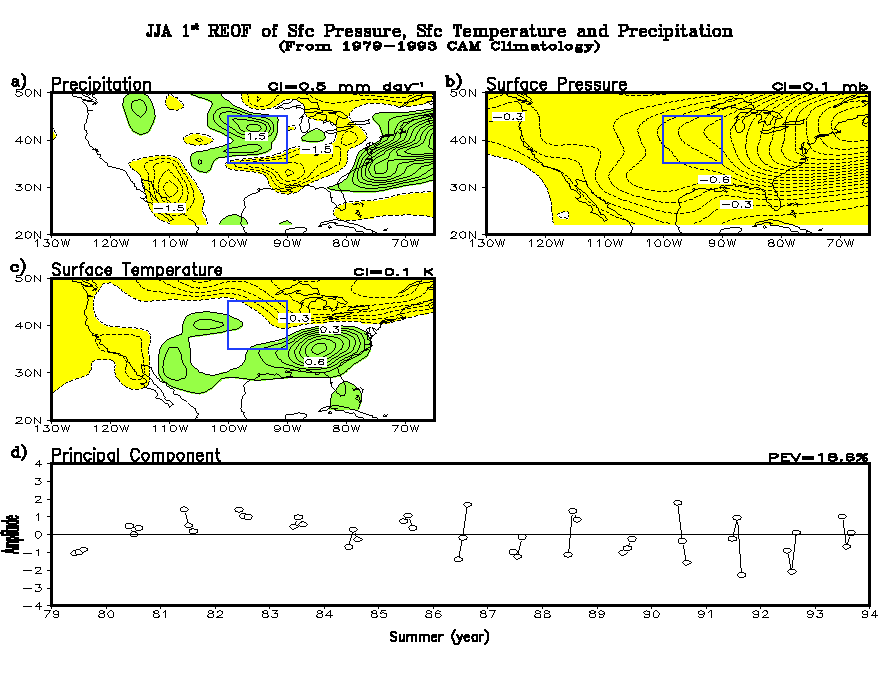
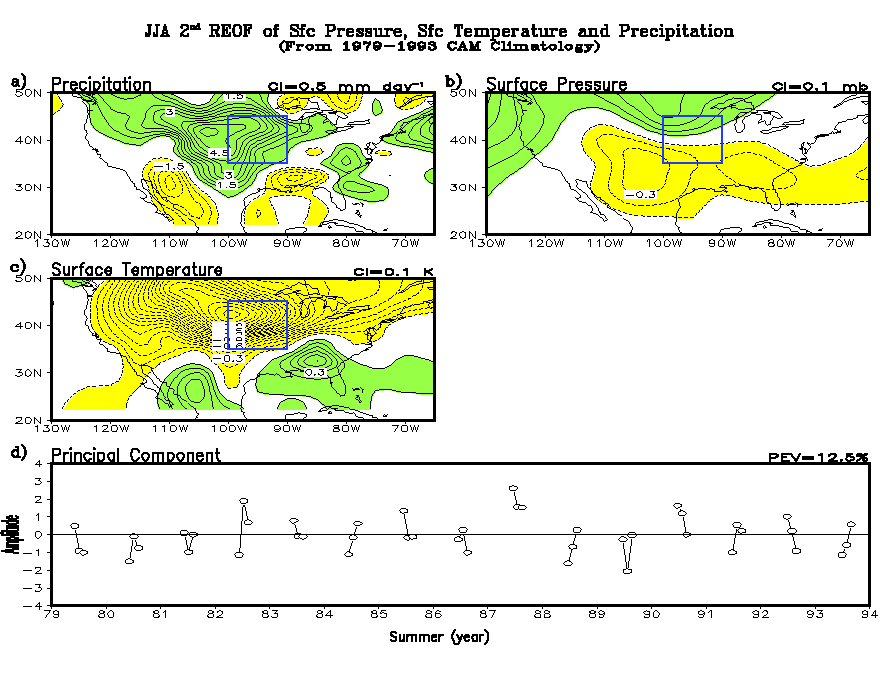
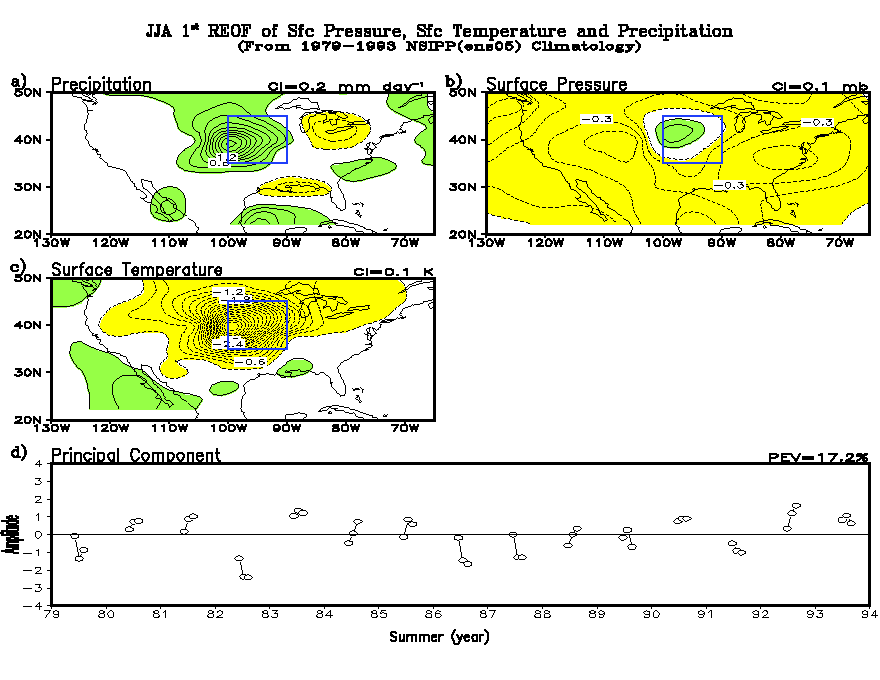
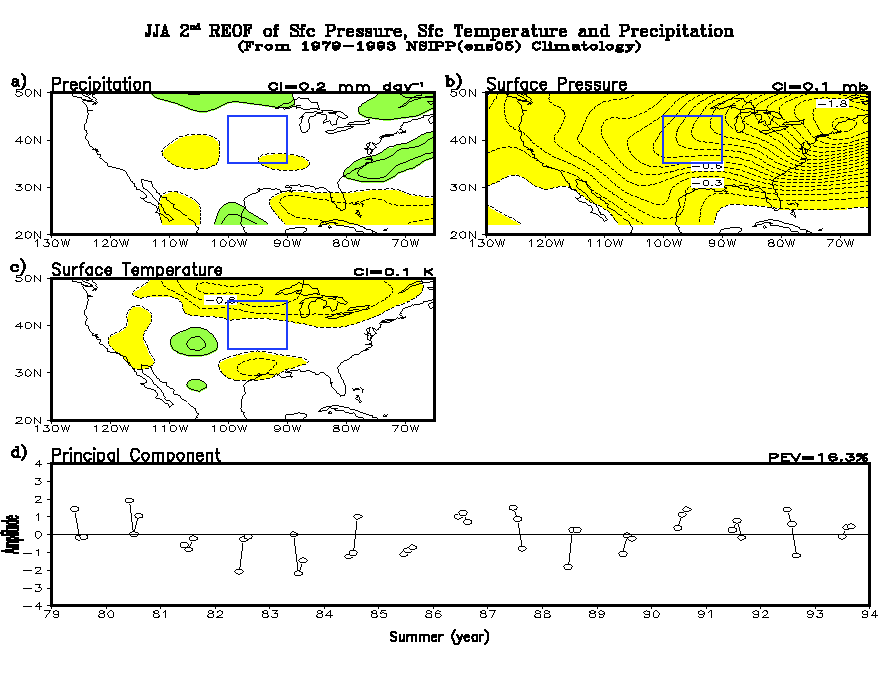
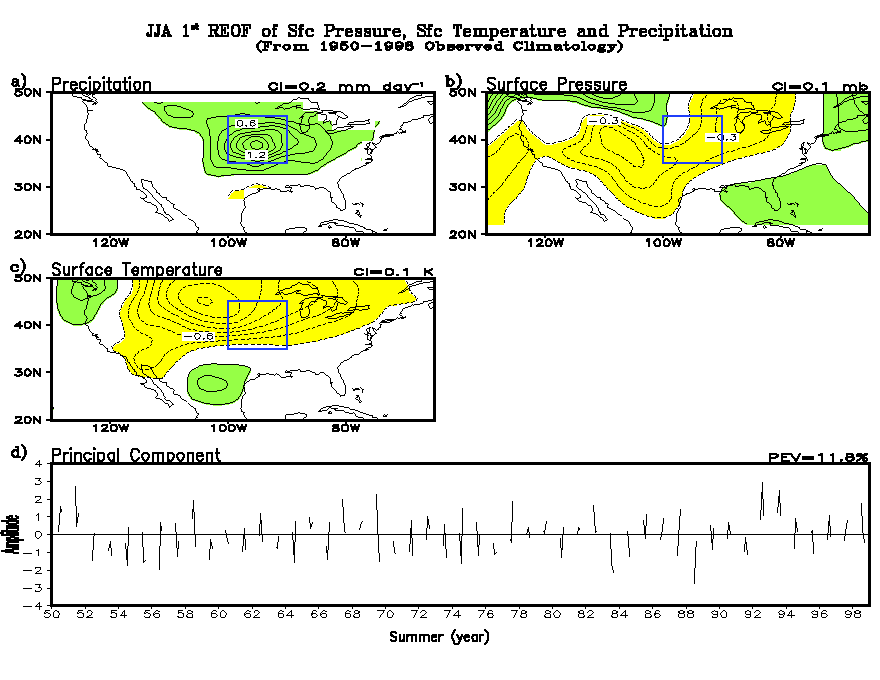
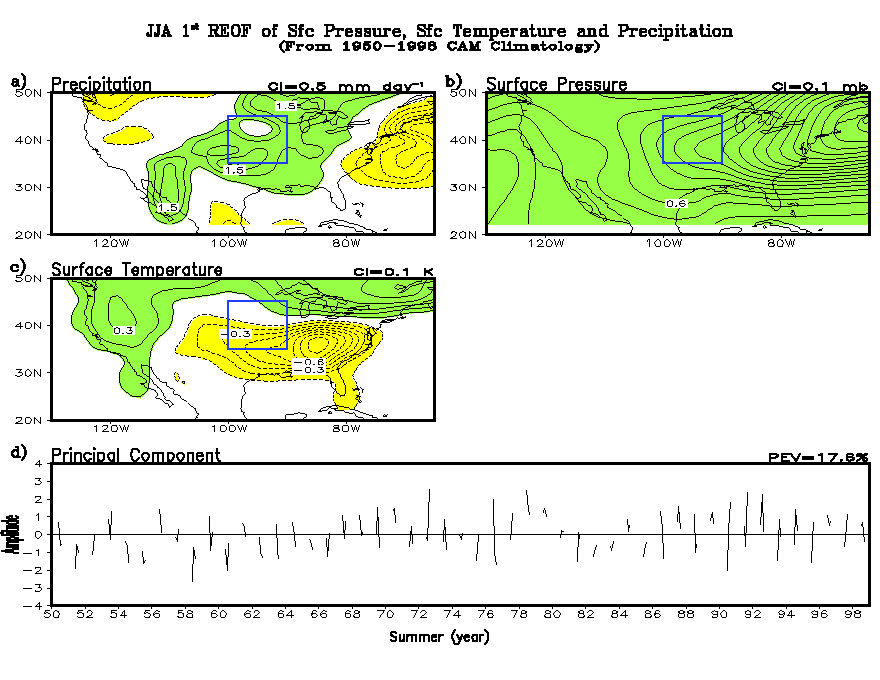
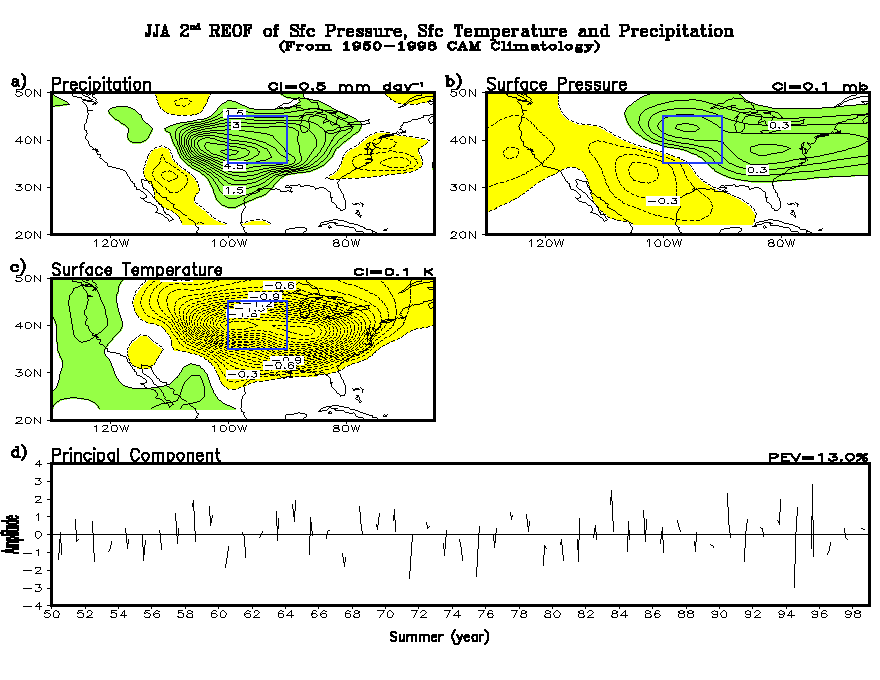
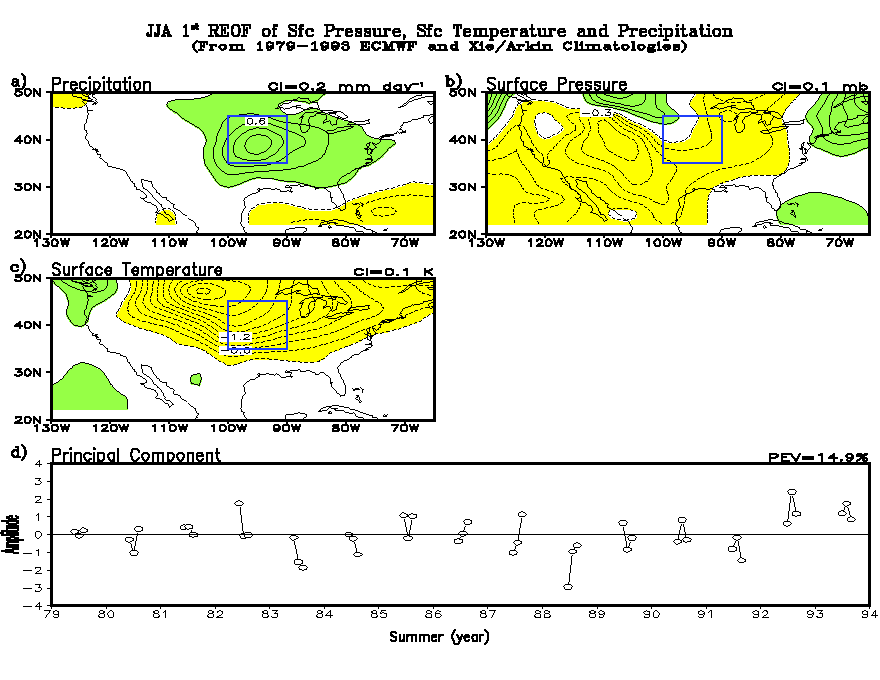
A way to identify the main patterns of precipitation that the modes have over North America is to perform a rotated EOF analysis. Such analysis is more meaningful if precipitation is combined with both surface temperature and surface pressure. The first two modes, after rotating 9 modes using the VARIMAX method, are shown next:
|
1st Observed (f12) |
||
|
ü Precipitation anomalies centered on the Great Plains region. ü Timing match the extreme events in 1988 and 1993. ü r(1stPC,GPIOBS)=0.8 |
ü Precipitation anomalies over central US are not the main pattern of variability. Anomalies are shifted to the west, and are double in extension with respect to observed data analysis. ü First pattern seems to be related to the North American Monsoon. ü r(2ndPC,GPICAM)=0.7 |
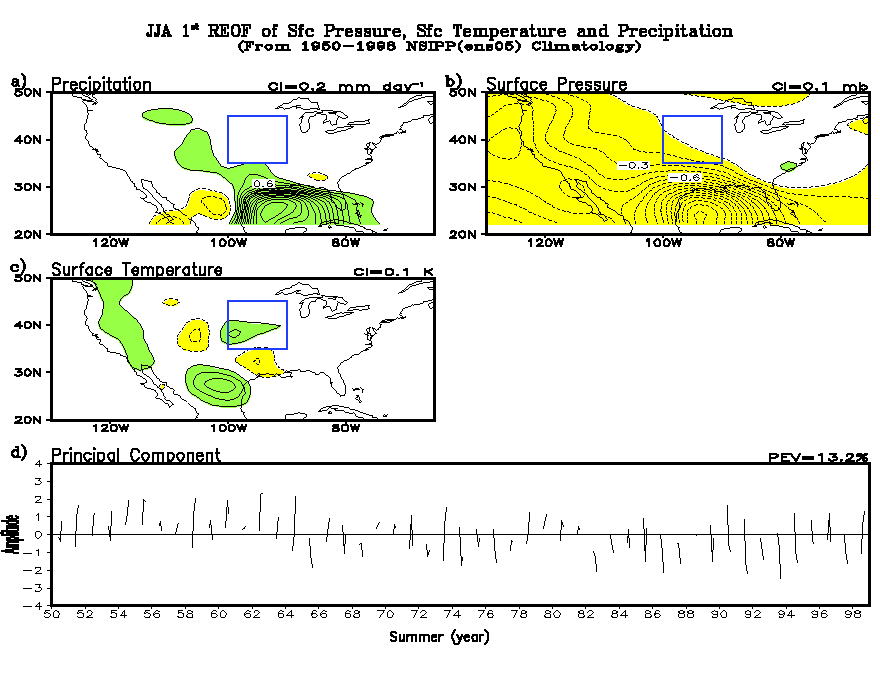
ü Precipitation anomalies over central US are the main pattern of variability. Anomalies cover about the same extension than those of observed analysis. ü Second pattern is similar to the first pattern from CAM model. ü r(2ndPC,GPINSIPP)=0.7 |
When the rotated analysis covers the 1950-1998 period the observed leading precipitation pattern is still centered over the Great Plains region (f17). The CAM precipitation patterns change in their structure with the first being of mostly one sign anomalies (f18) over the US, and the second being more centered over the Great Plains region(f19). The NSIPP precipitation patterns change in order, with the first being related to a model bias over the Gulf of Mexico(f20), and the second being the Great Plains pattern(f21).
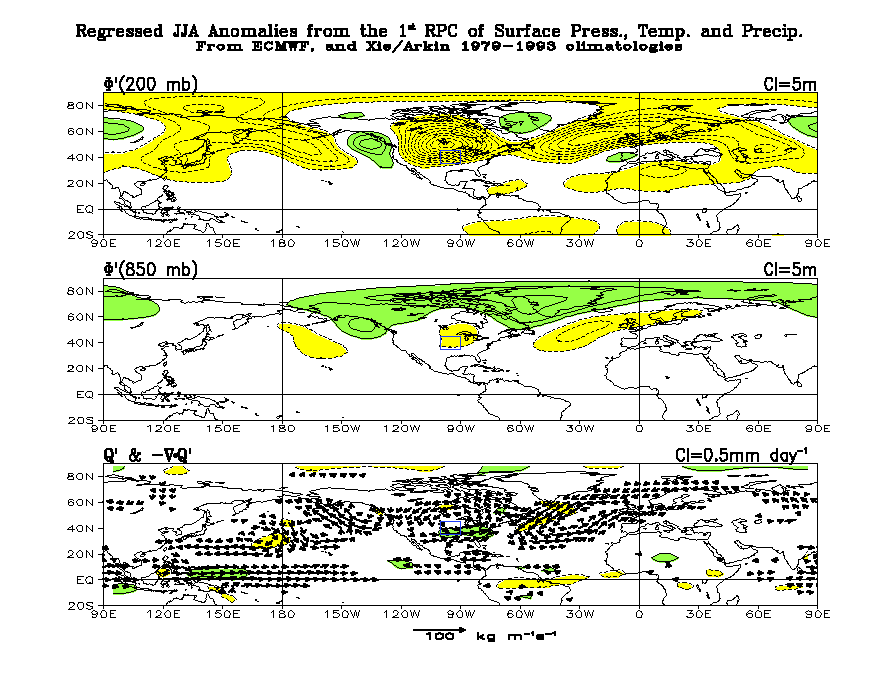
Regression of the Rotated Principal Components shows the dynamics of those patterns:
|
1st Observed (f22) |
||
|
ü Consistency with the regressed Great Plains precipitation index: ü Southerly moisture flux from a center of VIMFD over the Gulf of Mexico to a center of VIMFC over the Great Plains region |
ü Similarities between the regressed 2nd mode and the regressed Great Plains precipitation index from the simulation: ü No southerly moisture flux from the Gulf of Mexico to the Great Plains region. |
ü No similarities between the regressed modes and the regressed Great Plains precipitation index from the simulation. |
When Using ECMWF reanalysis data set for surface
pressue and temperature and combining them with Xie/ARkin precipitation data
set does not change at all the described features of the 1st
observed mode. Regression upon geopotential heights and vertically
integrated moisture fluxes of the principal component confirm the mentioned
features for the NCEP reanalysis case.
4.
Conclusions.
The previous analyses point toward two main features of observed and simulated hydroclimate over the US during the warm season:
1) Observed precipitation anomalies can be linked to mean southerly moisture flux from the Gulf of Mexico.
2) Simulations do not present the observed southerly mean moisture flux, however they do have a maximum of precipitation over the region.
This may suggest a more active role of transients transporting moisture toward central US in the models than the observations suggest. Analysis of the transient activity is mandatory to try to explain the differences.
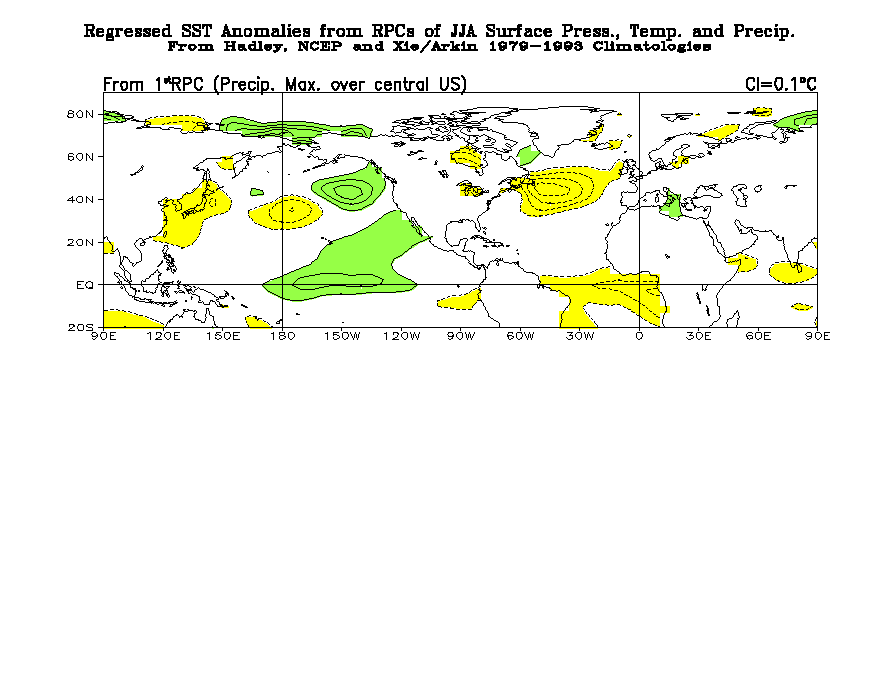
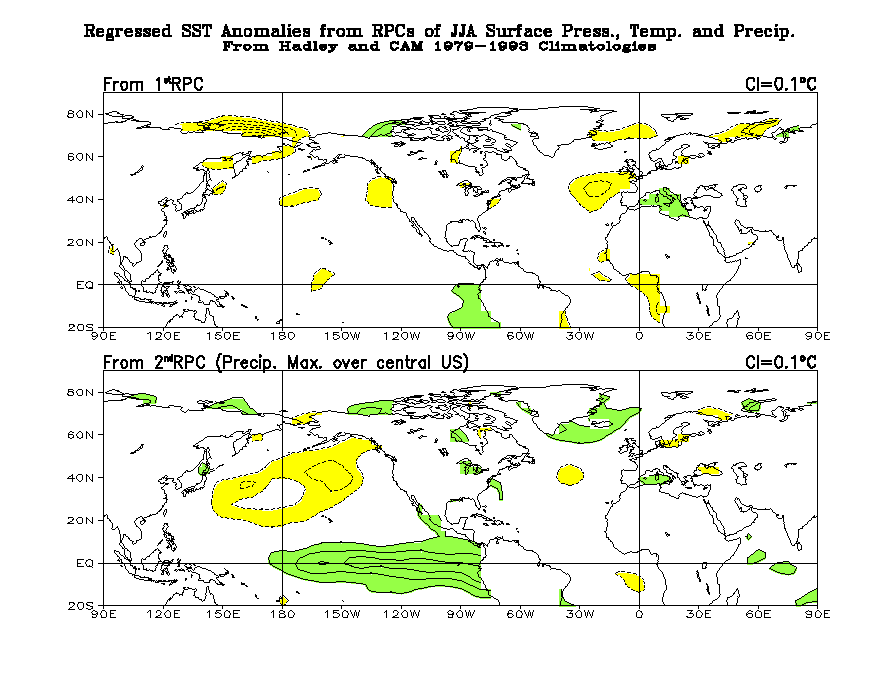
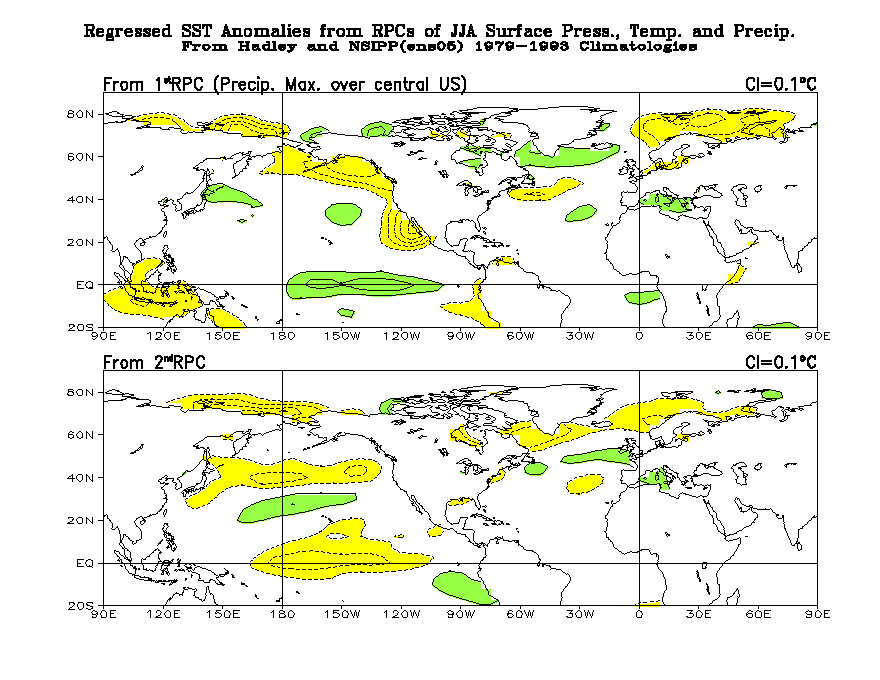
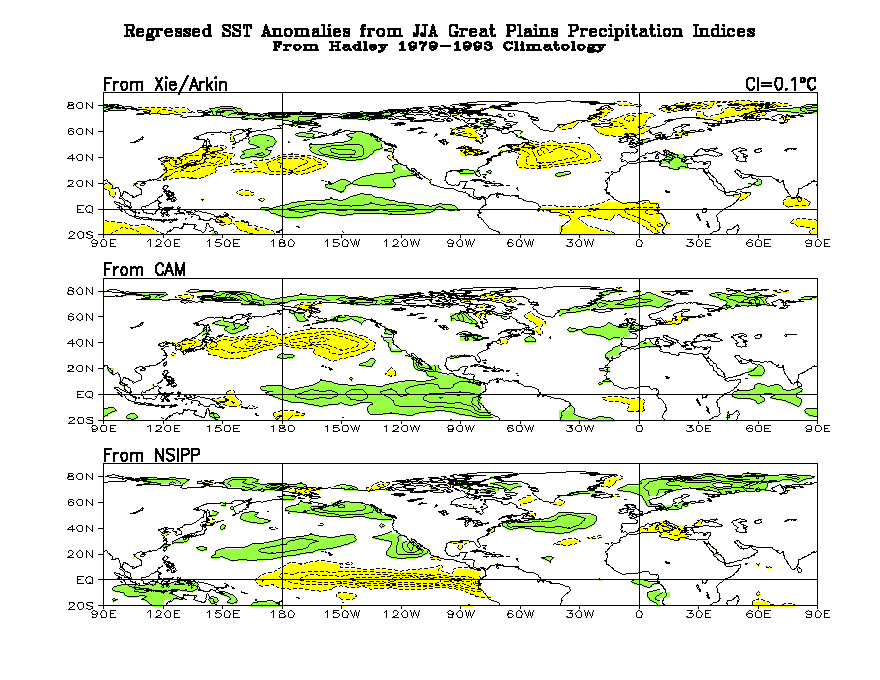
An interesting point to note is when the time
series of the REOF analyses are regressed against SST anomalies. While the regressed
SST anomalies from the observed analysis (f27) have the largest anomalies over the North Atlantic,
together with a Pacific Decadal-like feature in the Pacific Ocean, the regressed
SST anomalies from the CAM simulation(f28)
emphasize equatorial features in the Pacific Ocean and the regressed
SST anomalies from the NSIPP simulation (f29) emphasizes a Pacific Decadal-like feature in the Pacific Ocean. That
those SST anomalies are behind the described precipitation anomalies over the
central US is corroborated by the
regression of the Great Plains precipitation indices on SSTs (f31).