(looking for coherence and stability of the modes)
Data. The primary sea surface temperature (SST) data set for this analysis is the Hadley sea ice and SSTs from the Hadley Centre for Climate (1870-2002, version 1.1). The data set is extrapolated from the original 1x1 grid to a 5x2 grid, and cut to the shorter 1945-2002 period. In what is to follow the main interest is on the decadal variability of the Pacific basin so special attention will be paid on those modes that capture such variability.
Methodology. Before doing anything, anomalies are calculated with respect to the monthly/season means (i.e. annual cycle removed), and then an area weighting of the anomalies is done in order to avoid bias due to unequal areas of a latitude-longitude grid. Finally, the weighted anomalies are normalized dividing them by the square root of the spatially integrated temporal variance. Modes of SST variability are extracted from a regular Rotated EOF analysis and from an Extended Rotated EOF analysis. In both cases a covariance based Rotated Principal Component Analysis of monthly SST anomalies for the mostly Pacific domain (120E-60W,20S-60N) is carried out. EOFs of the covariance matrix are obtained from the Singular Value Decomposition analysis of SST anomalies in the regular analysis, and of combined lagged SST anomalies for the extended analysis. The eigenvectors are then rotated using the VARIMAX technique.
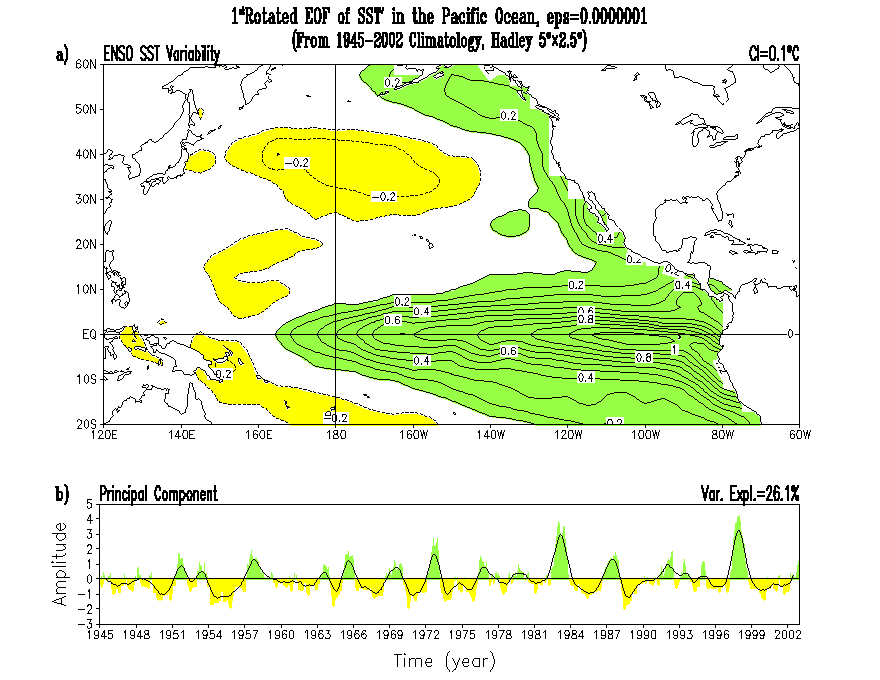
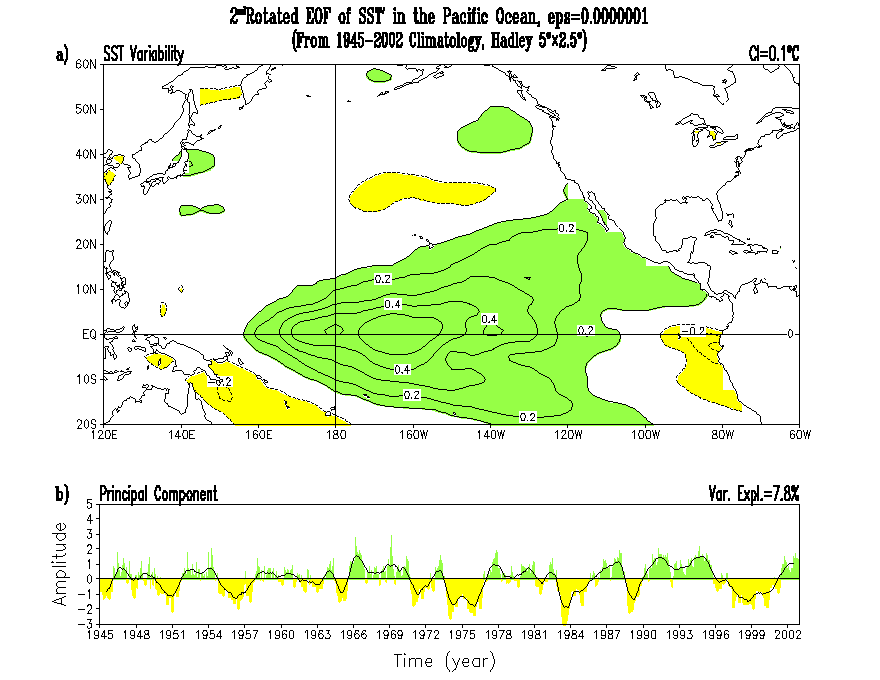
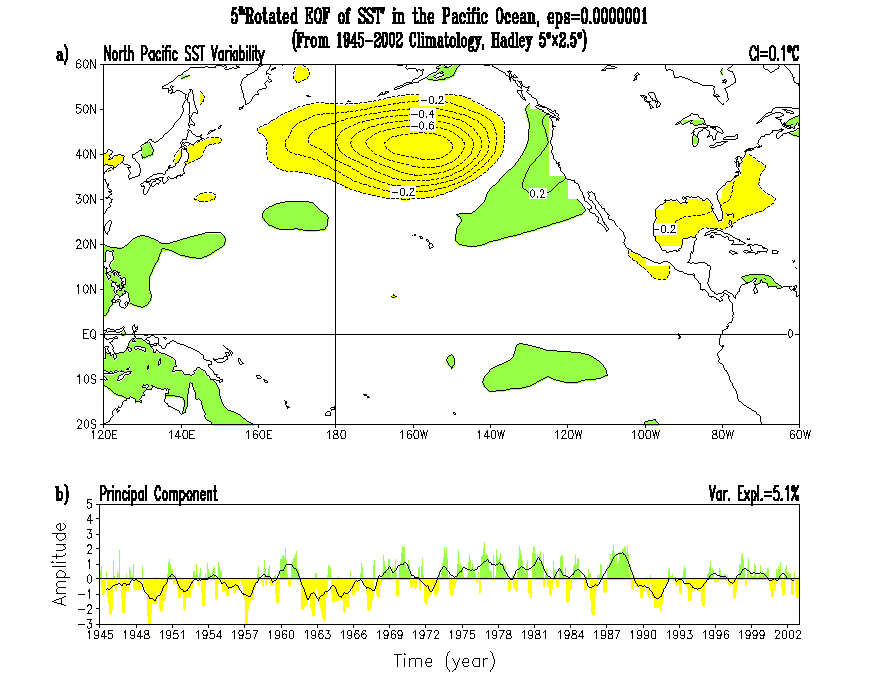
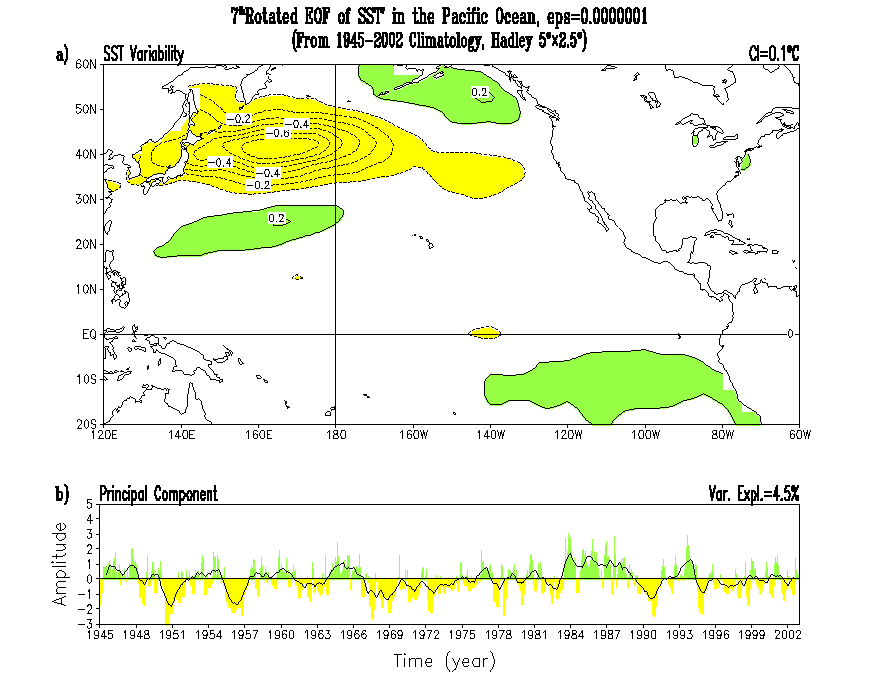
Basic Experiments. It is possible to identify five main patterns from de rotated EOF analysis performed for the 1950-1993 period, namely, ENSO, Pacific Decadal, North Pacific, Western Pacific, and a "less-than-shape" equatorial pattern. However, when the analysis is performed for the 1945-2002 period two additional patterns emerge, one of which is trend related; the five patterns mentioned before are now in the first 7 patterns: ENSO, "less-than-shape", Pacific Decadal, North Pacific, Western Pacific. As for the 1950-1993 period, 9 eigenvectors are rotated explaining 66% of the variance (and about the same variance than for the shorter period). Those results impose some basic questions about the coherence and sensitivity of the modes to a number of things like to the length of the period, and the number of EOFs to be rotated. An extension of those questions may be the dependence of the identified modes on the type of analysis performed.
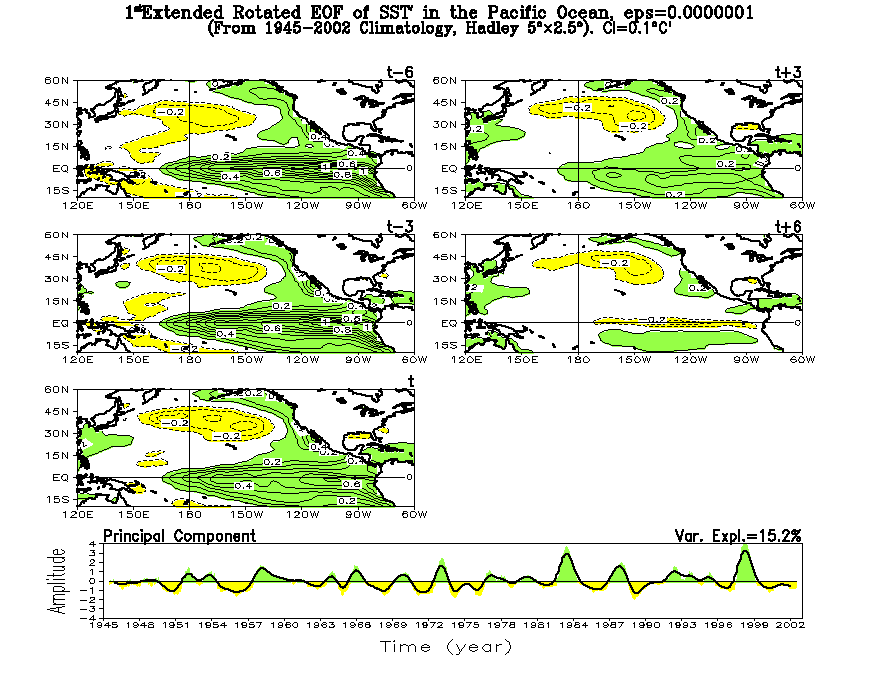
An alternative approach in identifying the main modes of variability in the Pacific basin, is to use the extended rotated EOF analysis (EREOF). The EREOF method identifies the dominant spatial and temporal structures of lagged sequences of covariances. This procedure is able to extract time evolving patterns because phase information is retained in the decomposition of the combined lagged data.
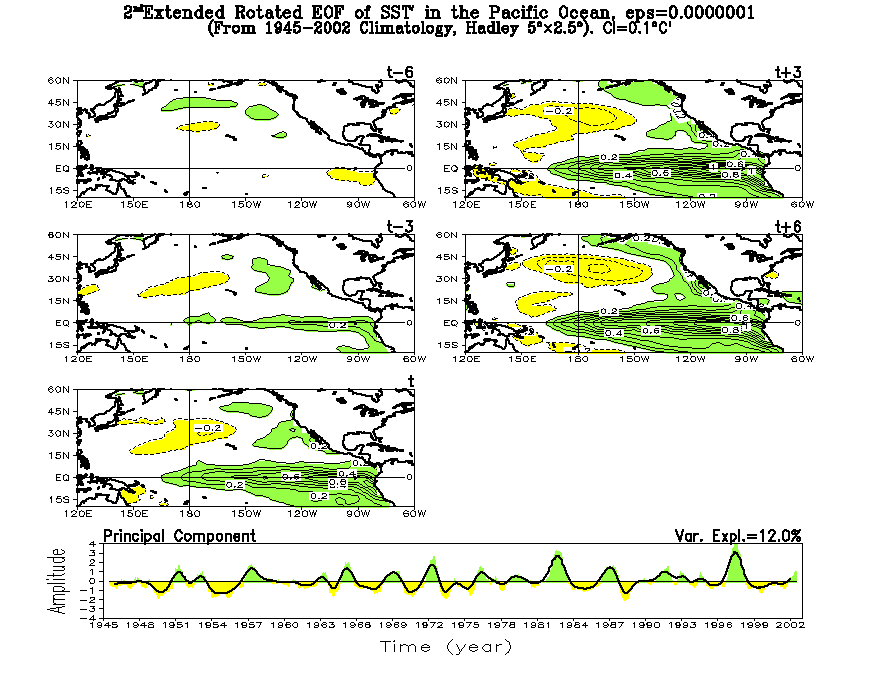
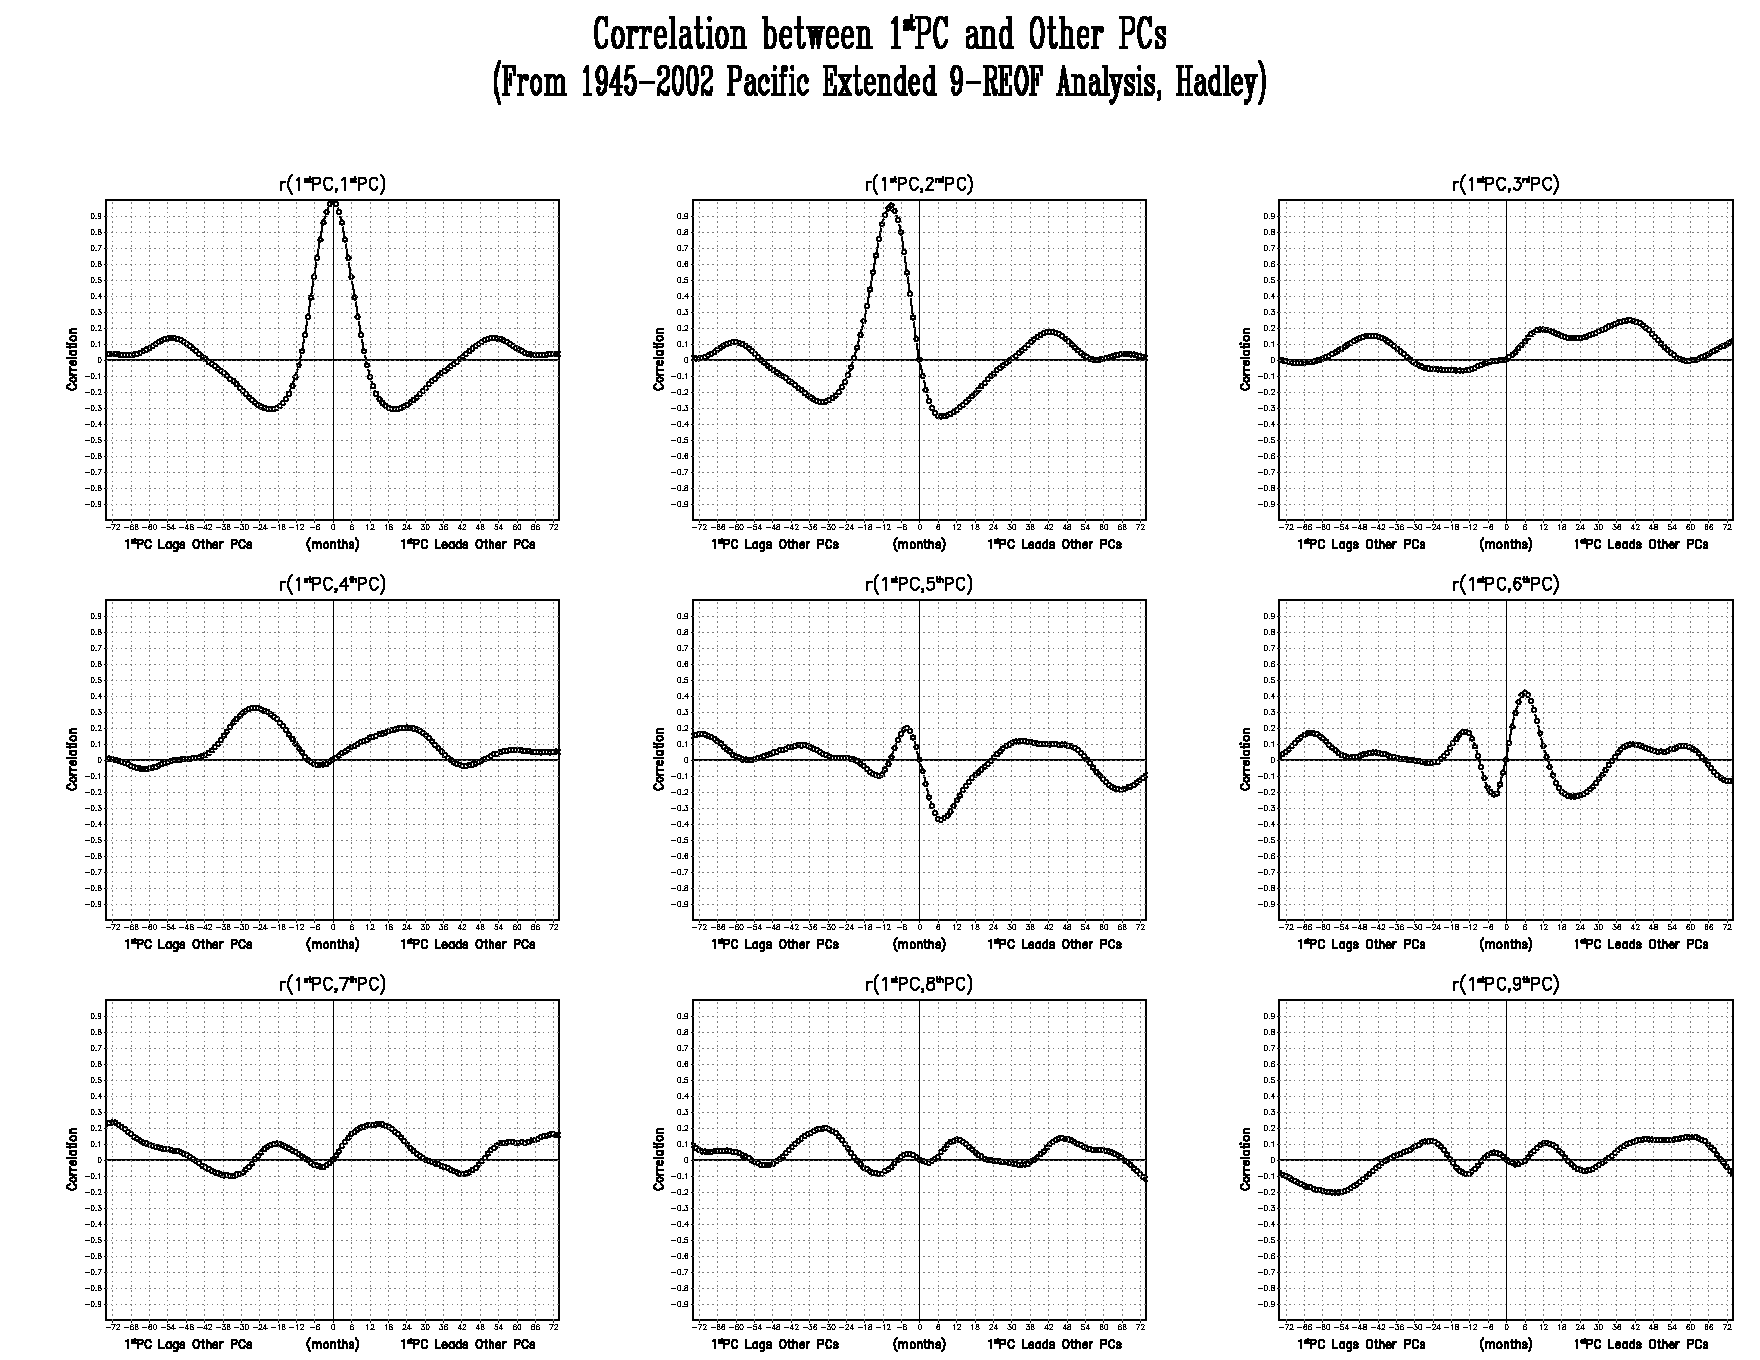
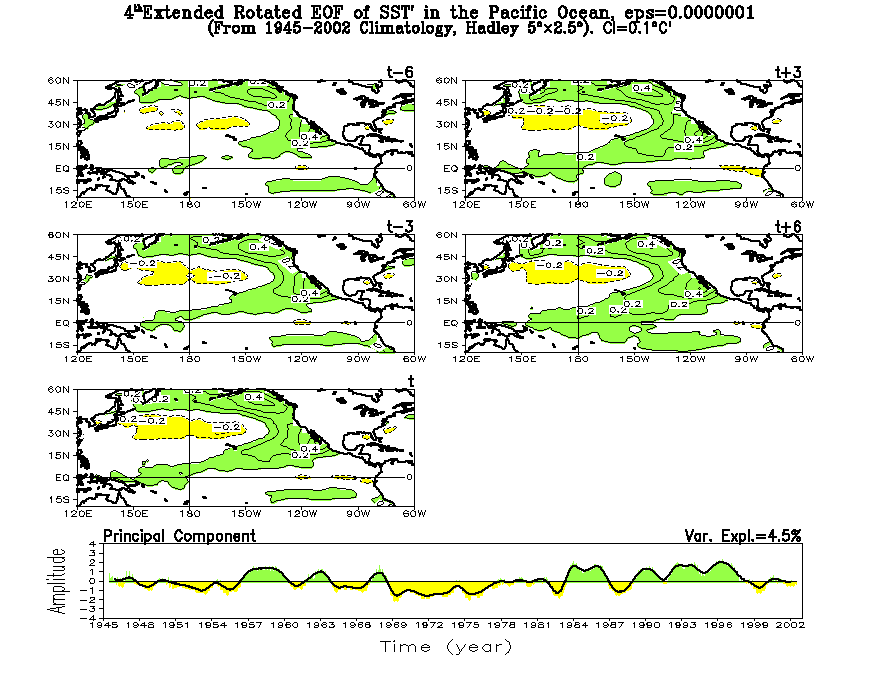
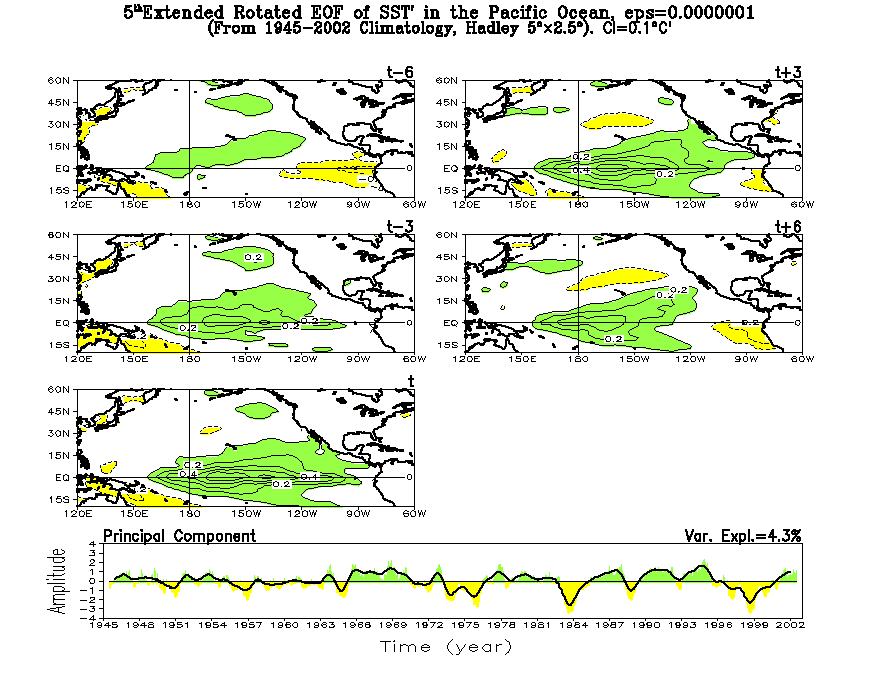
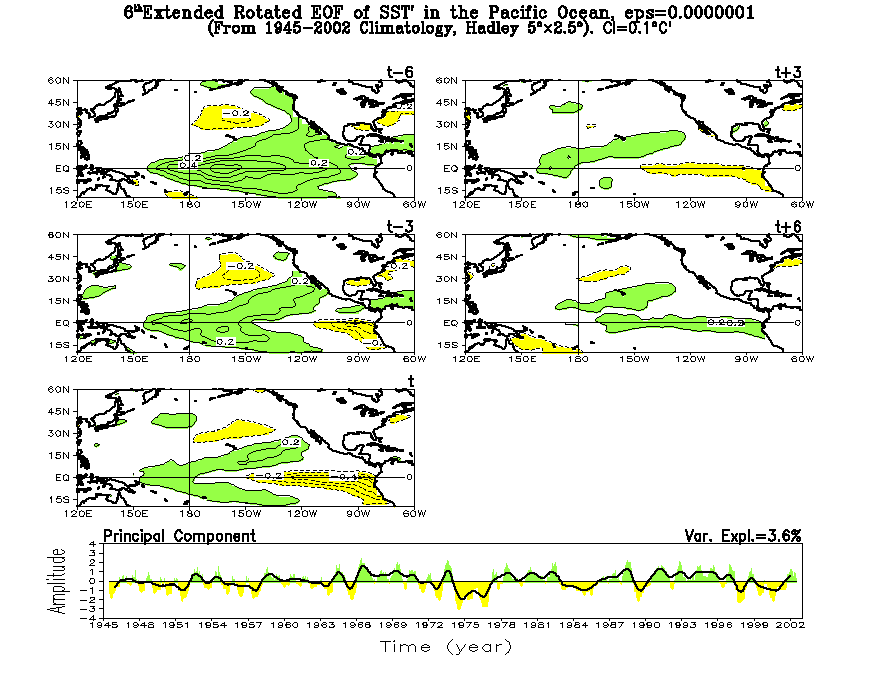
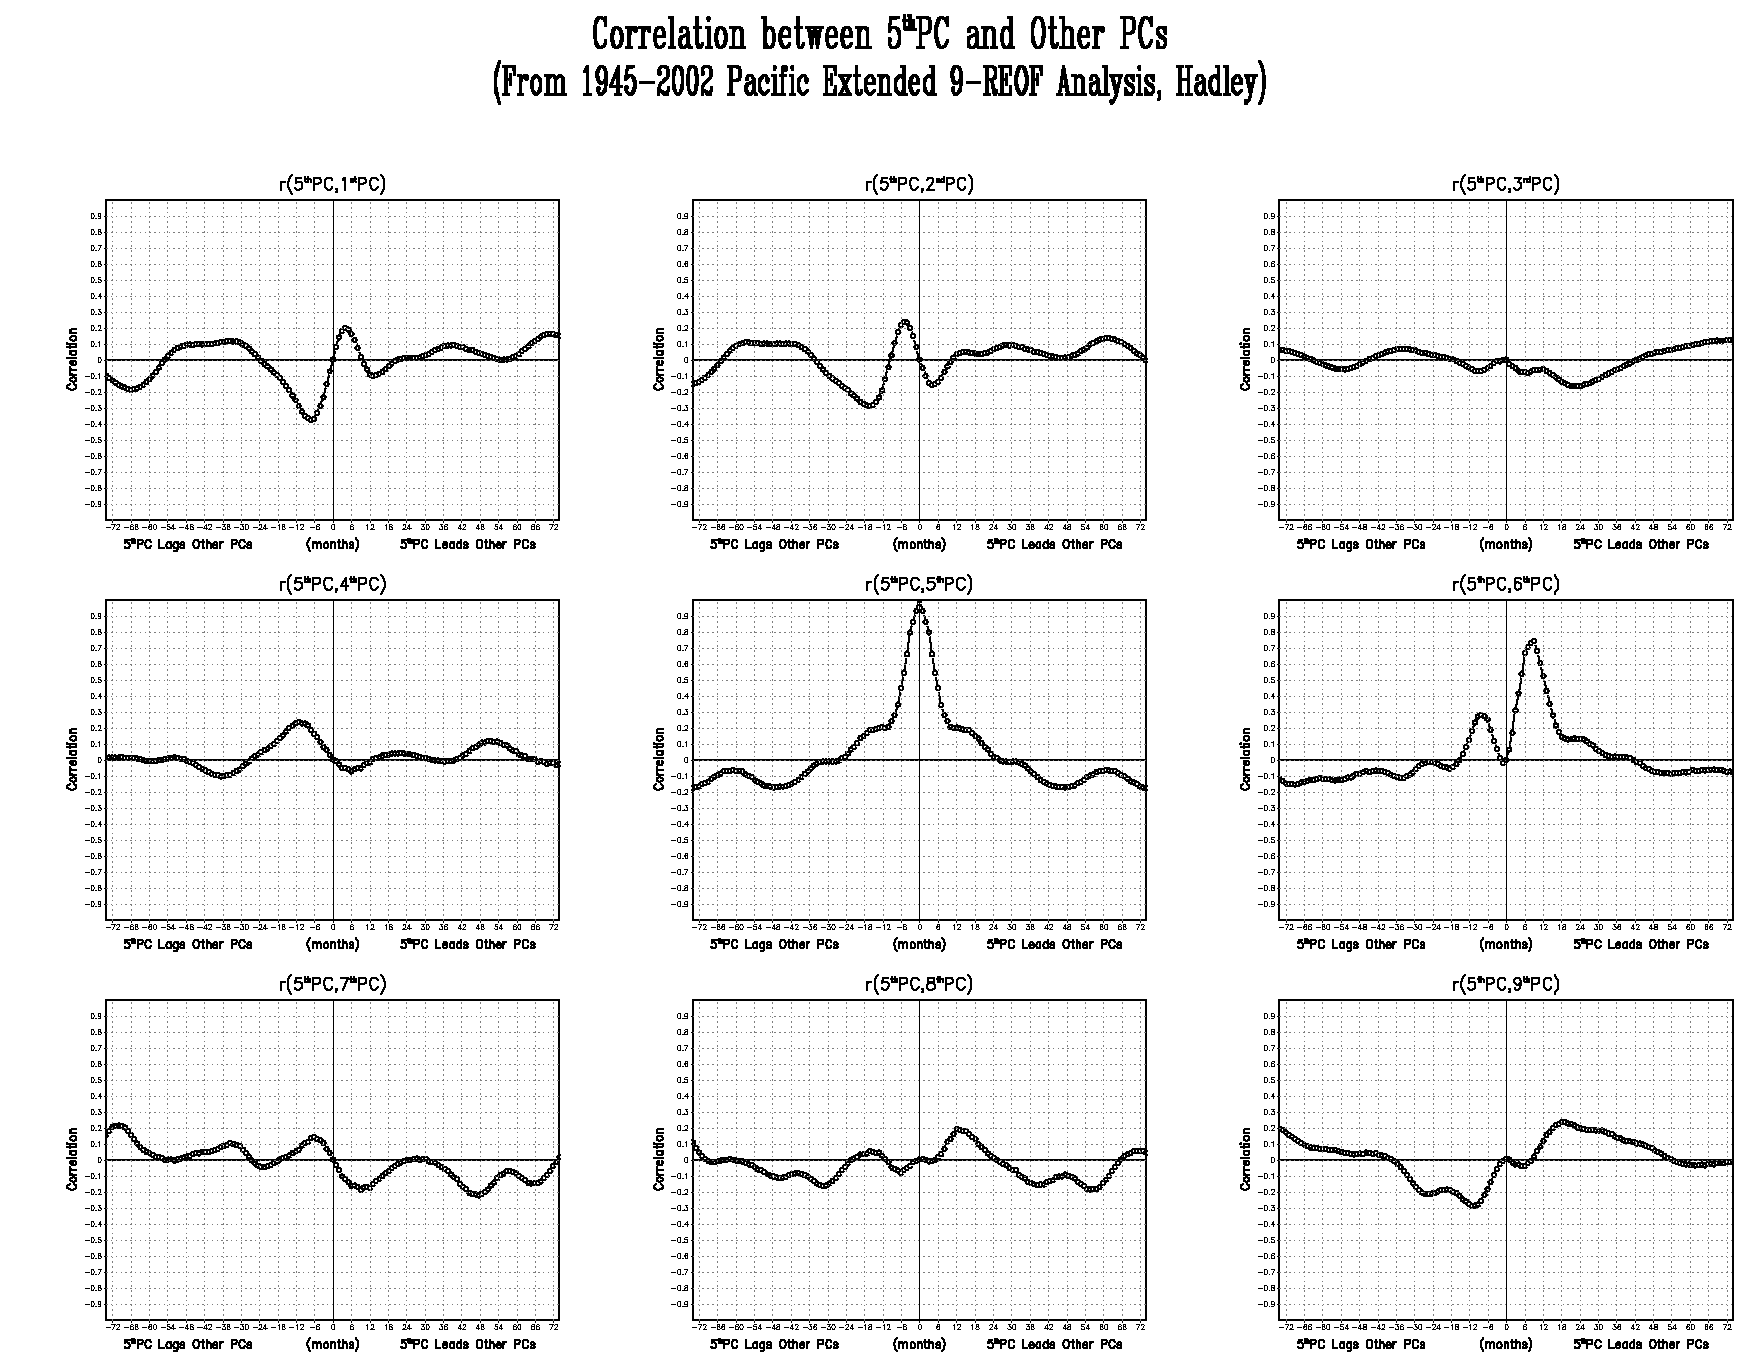
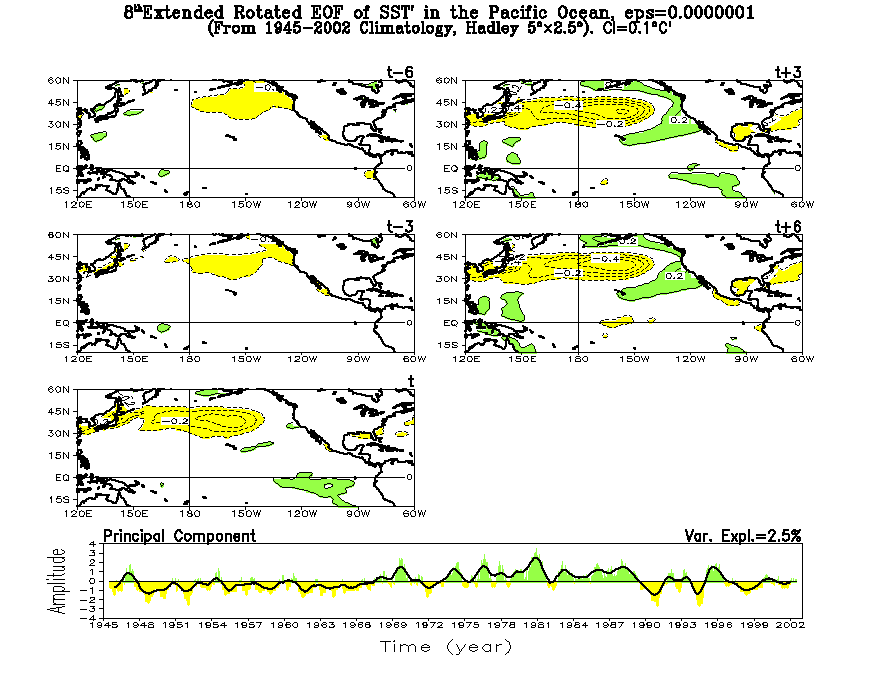
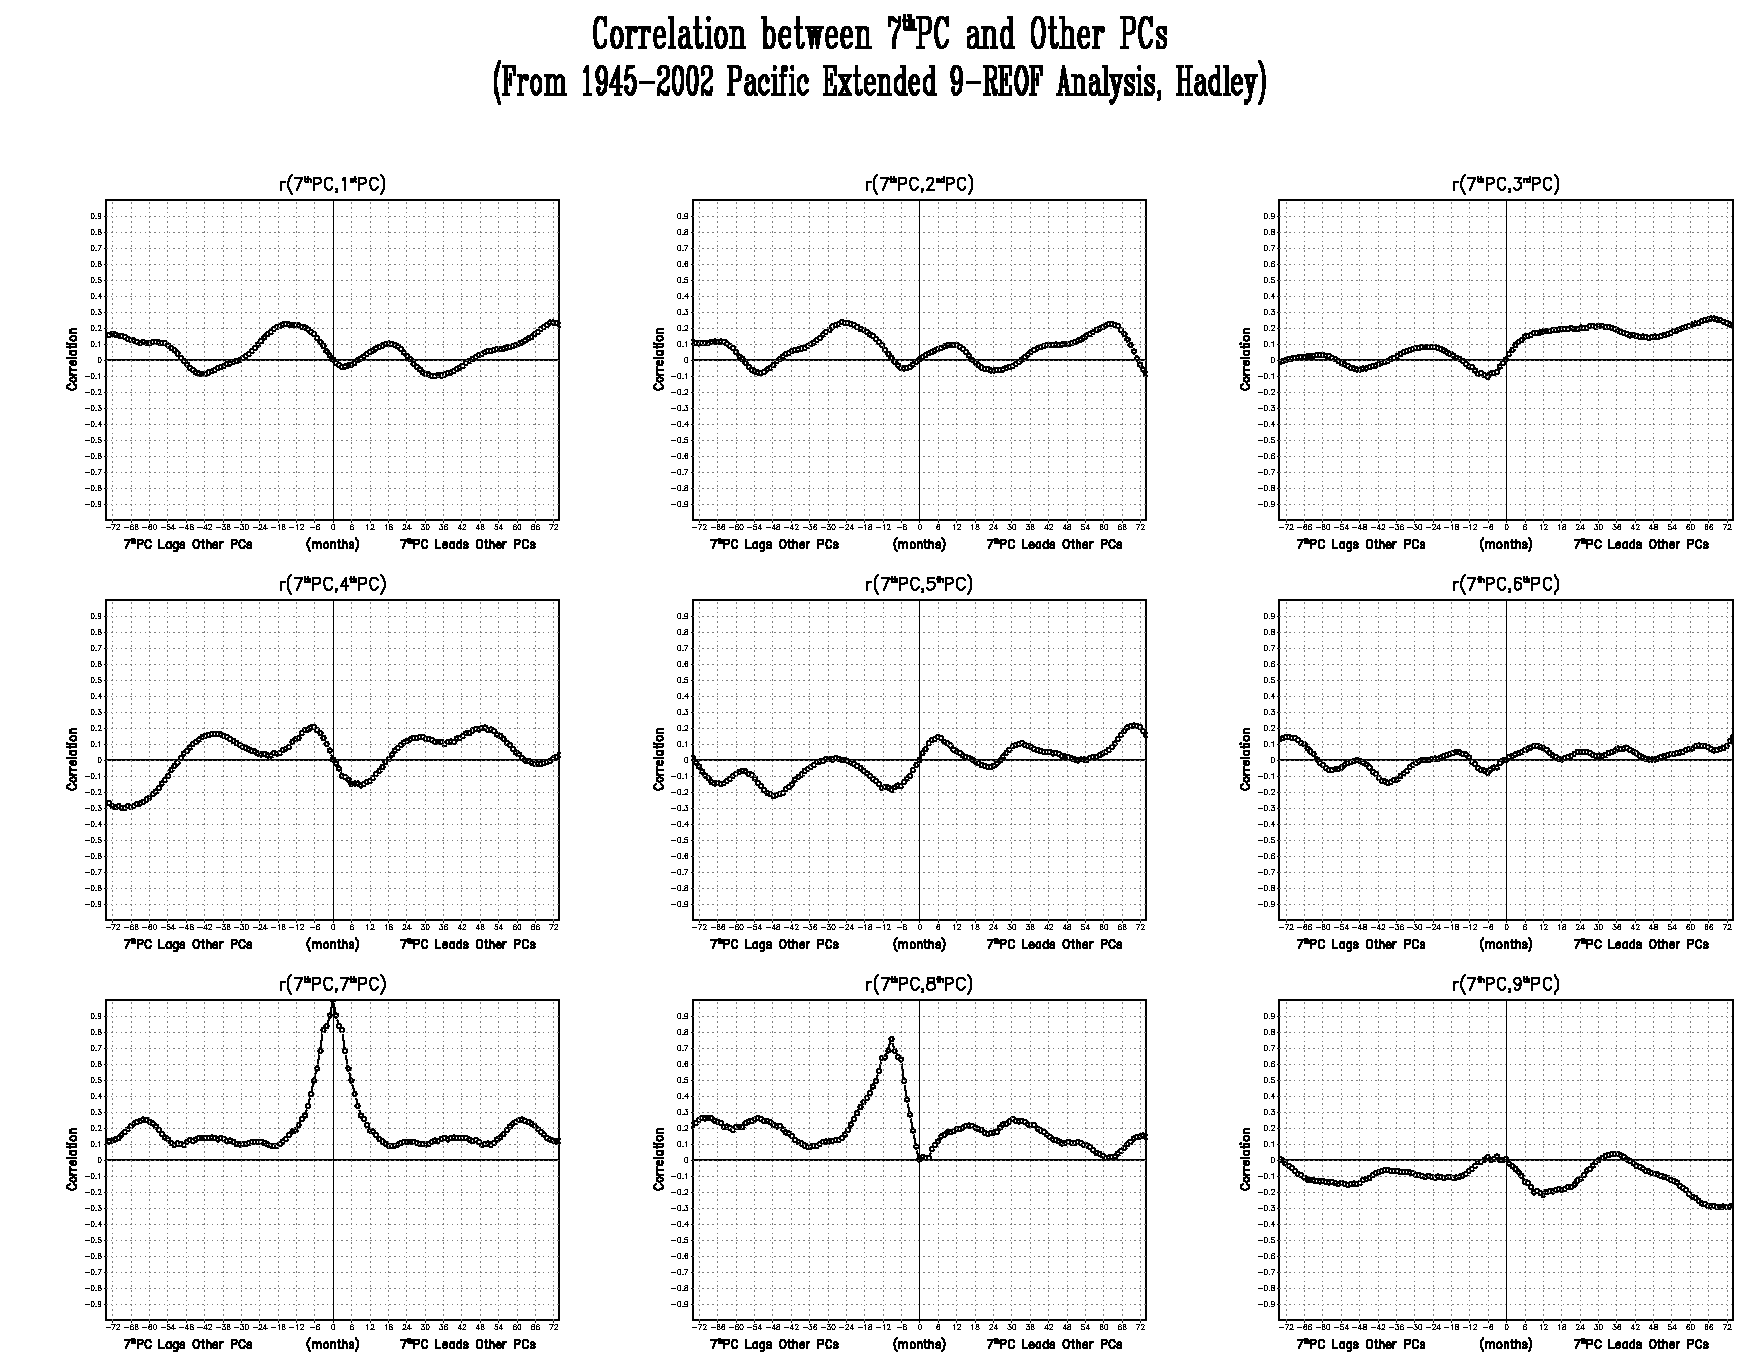
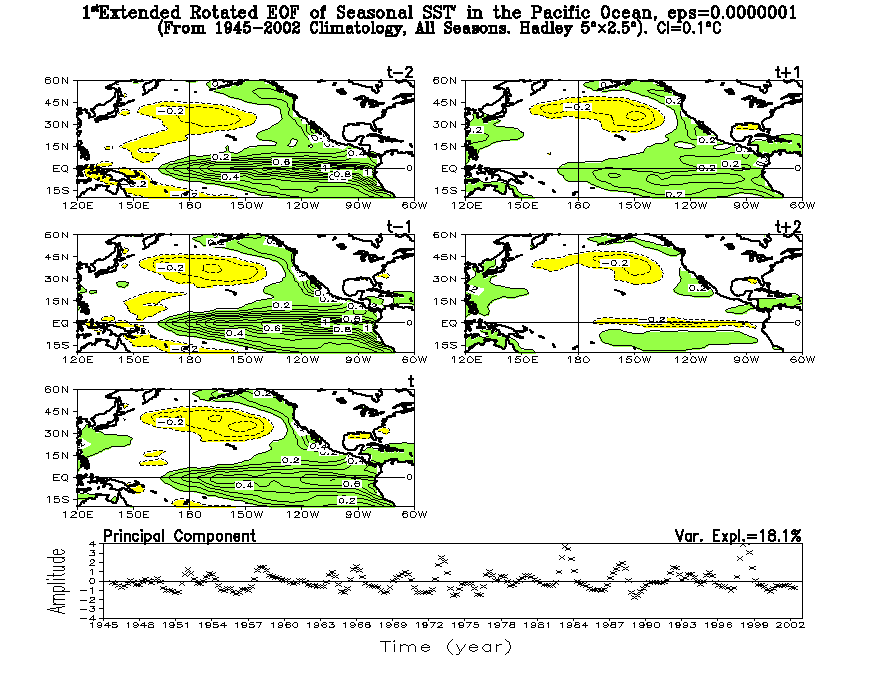
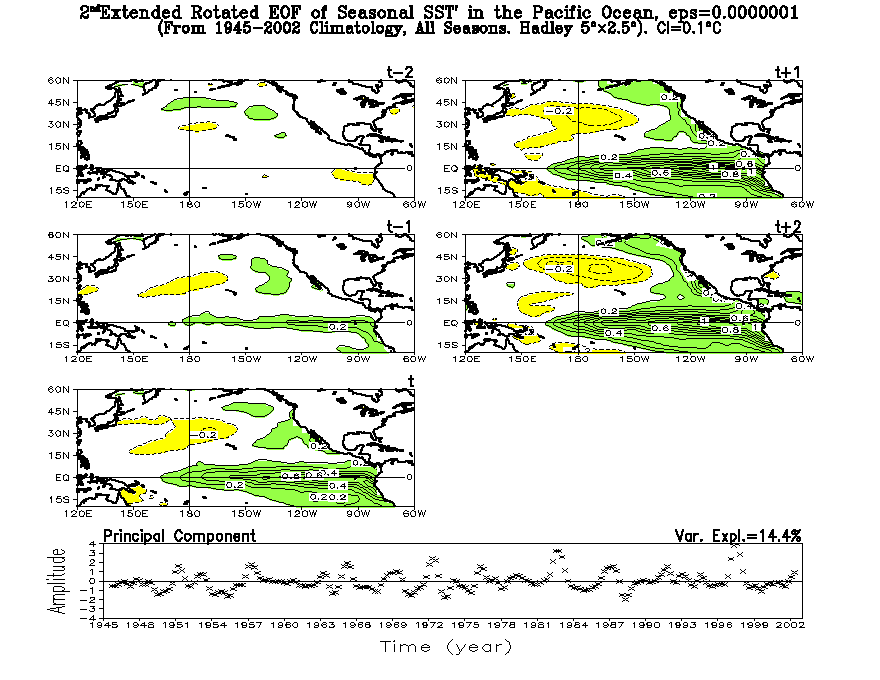
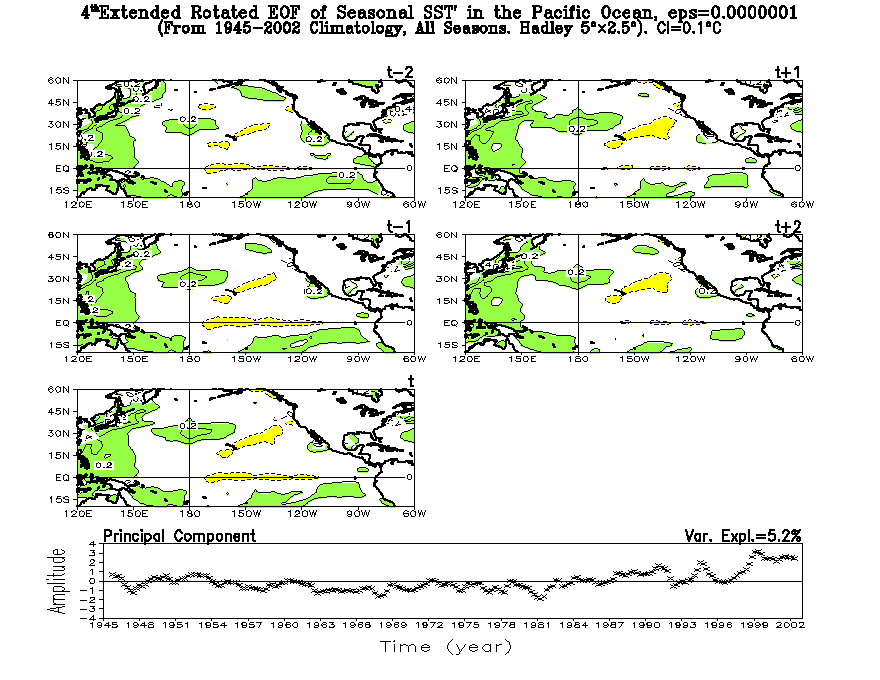
An EREOF analysis is done for monthly SST anomalies in the 1945-2002 period using 5 "lags" of three months centered around the period July 1945-June 2002 (i.e. 2 "lags" before this central period, the central period, plus 2 "lags" after the central period so that every lagged SST field contains 684 months). After rotating the first 9 eigenvectors, which explain a combined variance close to 52%, it is possible to identify the main named modes from the regular analysis, however, some of the patterns seem to be split in two "modes" lagged in time. ENSO occupies the first and second modes (with the first lagging the second by 9 months ); a linear trend is evident in third place; the Pacific Decadal pattern is seen in fourth place; the equatorial "less-than-shape" pattern occupies the fifth andsixth places (with the fifth leading the sixth by 9 months); the Western and North Pacific patterns take the seventh andeighth places respectively (with the seventh lagging the eighth by 9 months too). Correlation between time series of both analyses confirm their association. Spectrum analysis of the PCs of the EREOF indicates the ENSO patterns have a main/secondary peak at ~3.5/5.7 years while the Pacific Decadal pattern has a main/secondary peak at ~28.5/5.7 years. There are two equatorial "less-than-shape" patterns from which the first of those has comparable peaks at ~8 and ~11.4 years, while the second pattern has peaks at ~11.4/28.5 years, however interannual and higher variability is relatively important in those modes. In turn, the Western Pacific pattern has a main/secondary peak at 57/5.7 years while the North Pacific pattern has a main/secondary peak at 57/3.8 years; however, similarities in spatial patterns and time series of these two modes make difficult to separate one from the other in this analysis and that will be postponed to a sensitivity analysis later.
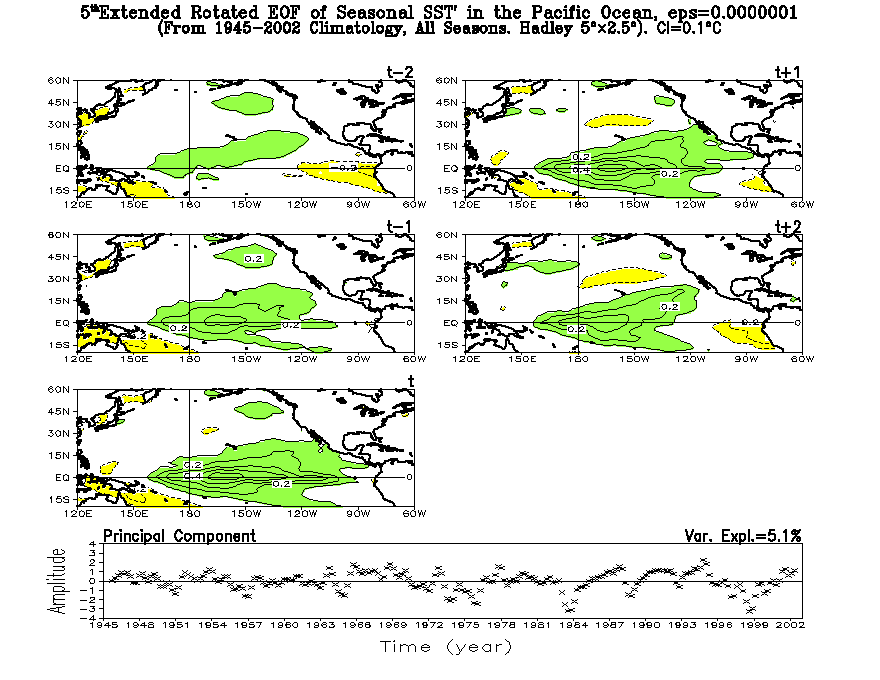
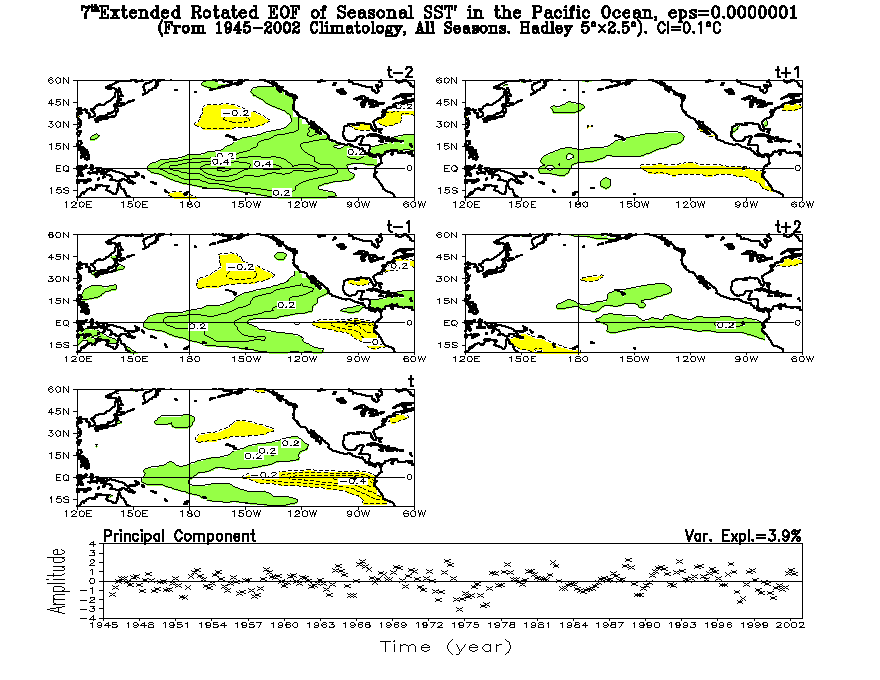
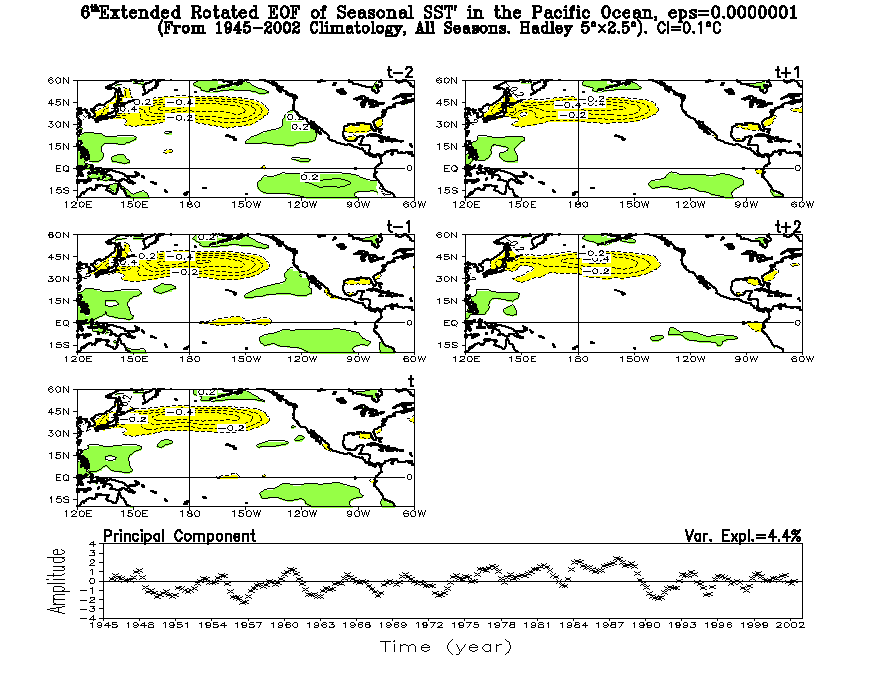
In order to minimize intraseasonal variability the EREOF analysis is repeated but for the seasons of the whole 1945-2002 period. In this case, similarly to the monthly case, 5 "lags" of 1 season are considered. Rotation of the first 9 eigenvectors explain now 61% of the variance (9% more than the monthly case!!) with some changes in the order of the patterns but not in their structure. ENSO patterns are still the same and first and second; Pacific Decadal pattern is now third, displacing the trend to fourth place; the equatorial "less-than-shape" patterns are not consecutive patterns and occupy fifthandseventhplaces. The most significant change is for the duality of midlatitude Pacific patterns that now are merged as one and located in sixth place.
For reference purposes the previous
analyses are labeled as follows:
| EXPERIMENT ID | ANALYSIS | PERIOD/UNIT | FIELD | DETRENDED? |
| EXP1 | REOF | 1945-2002 / MONTHLY | SST | NO |
| EXP2 | EREOF: 5 lags of 3 months | 1945-2002 / MONTHLY | SST | NO |
| EXP3 | EREOF: 5 lags of 1 season | 1945-2002 / SEASONAL | SST | NO |
It is apparent from the previous
analyses that the appearance of the equatorial "less-than-shape" pattern
complicate matters in the identification of a clear separation of the Pacific
Decadal pattern and decadal variability along the equator and along the
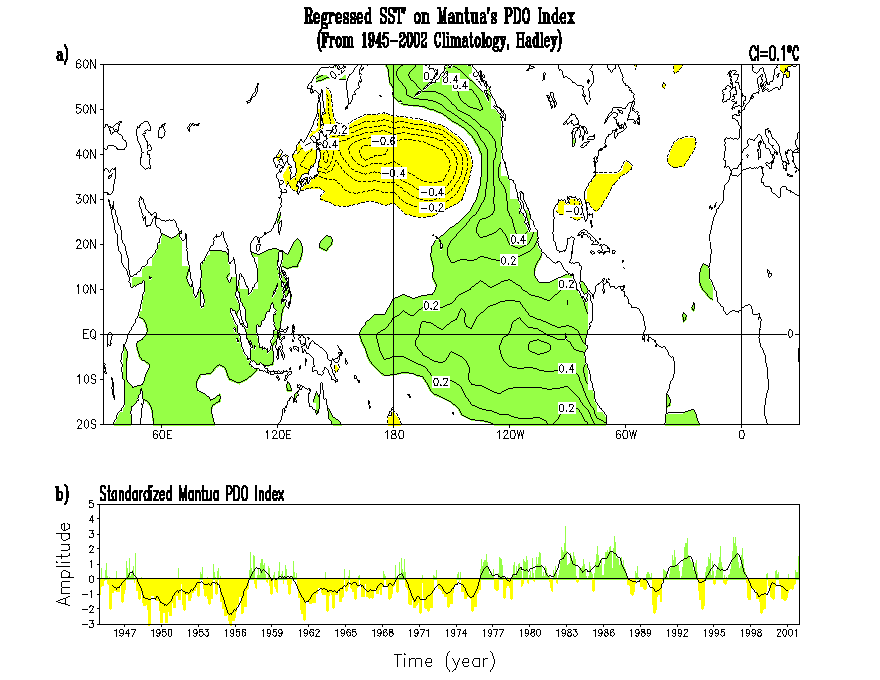
west coasts of Mexico and the US. Comparison of the already shown patterns
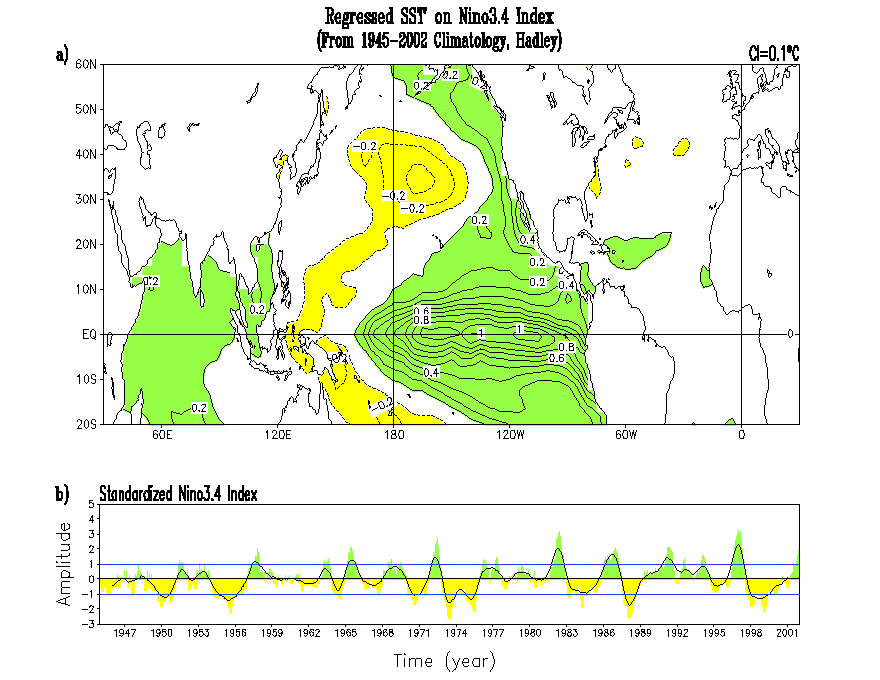
with regressed SST anomalies on the well known Mantua
and NINO3.4indices
does not provide any insight because the similarities between the regressed
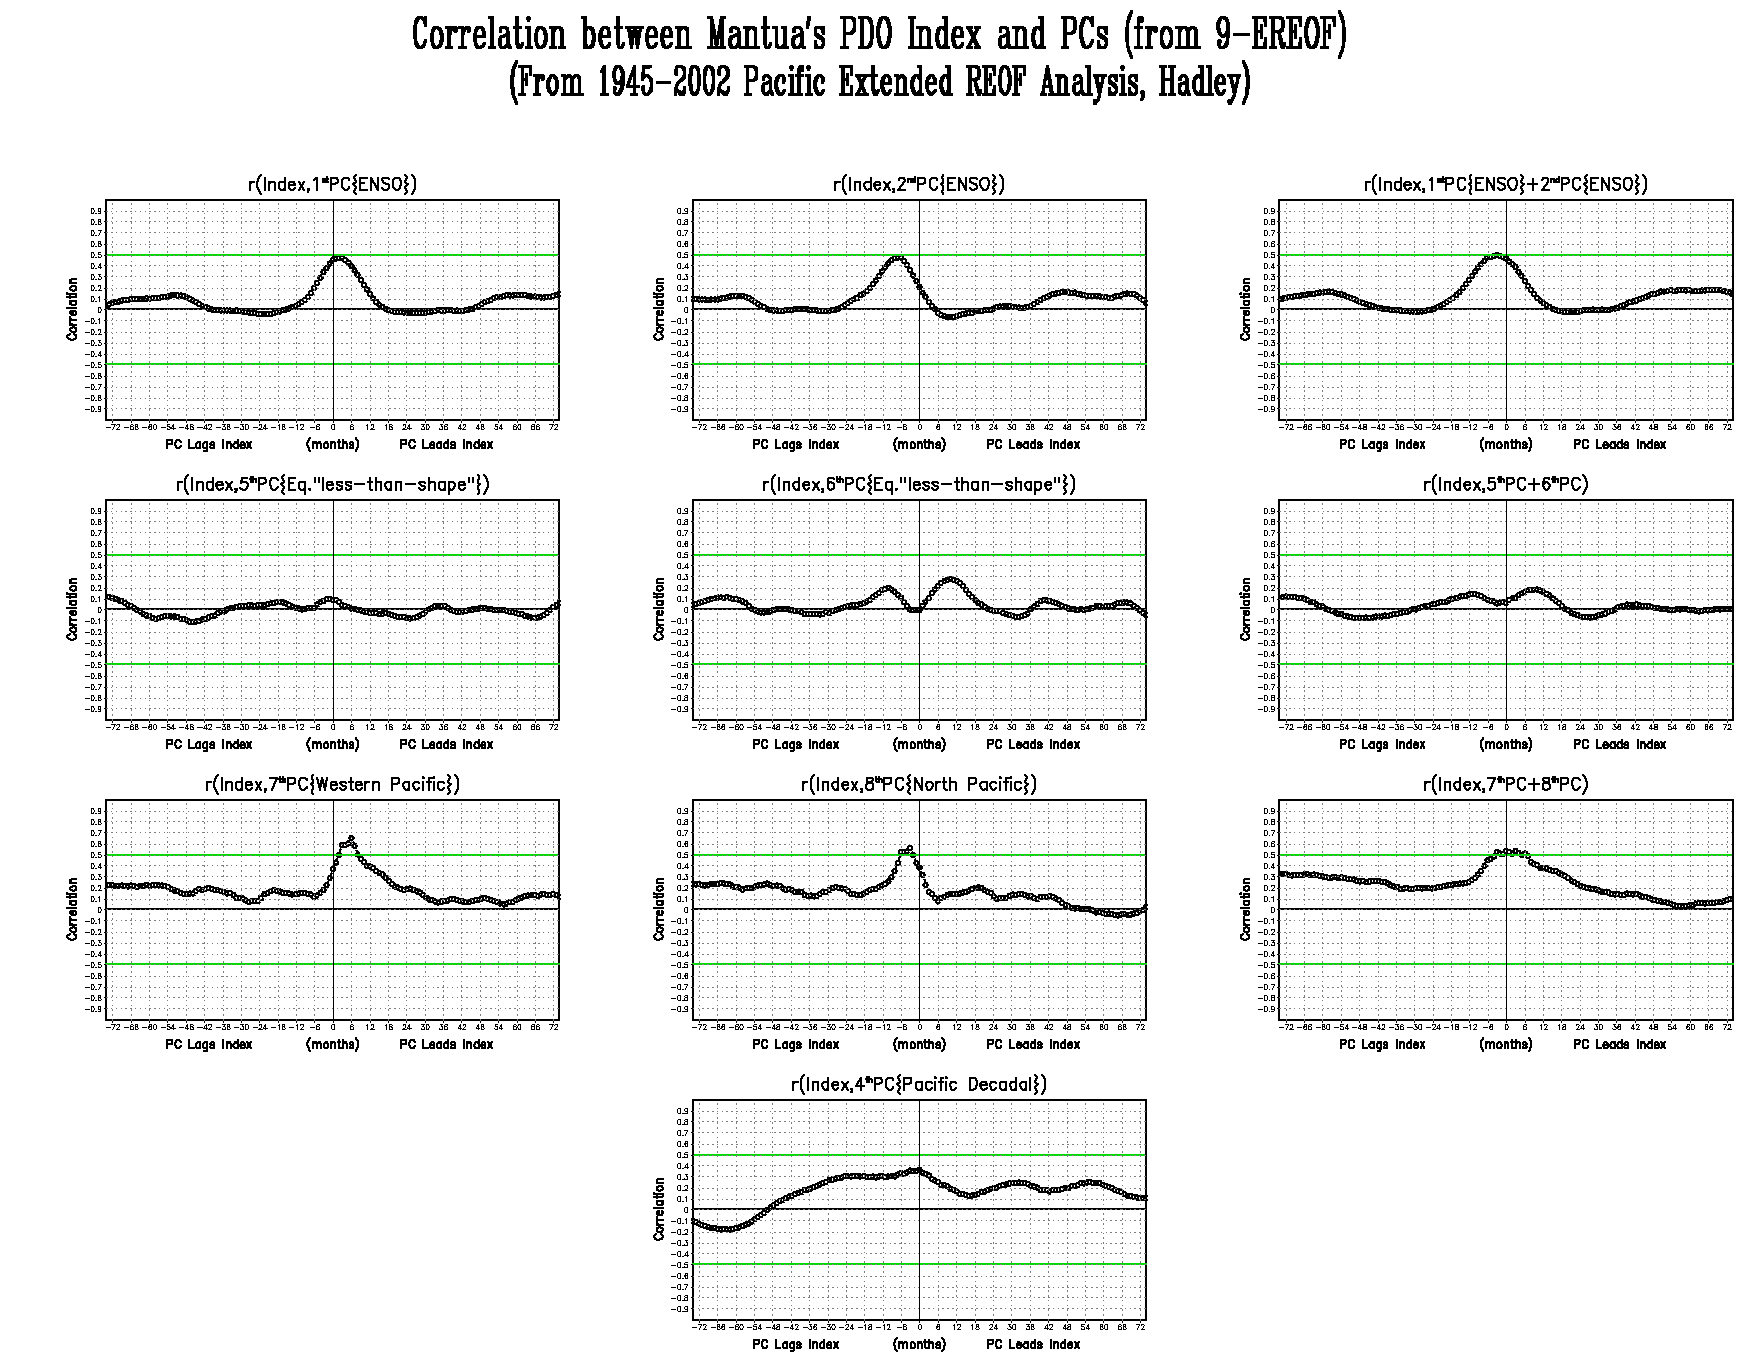
fields and several patterns of the extended analyses. Correlations
between Mantua index and PCs of the midlatitudes
Pacific patterns are between 0.55-0.65, and those with ENSO patterns are
not low at all (~0.5) while correlations with the Pacific Decadal pattern
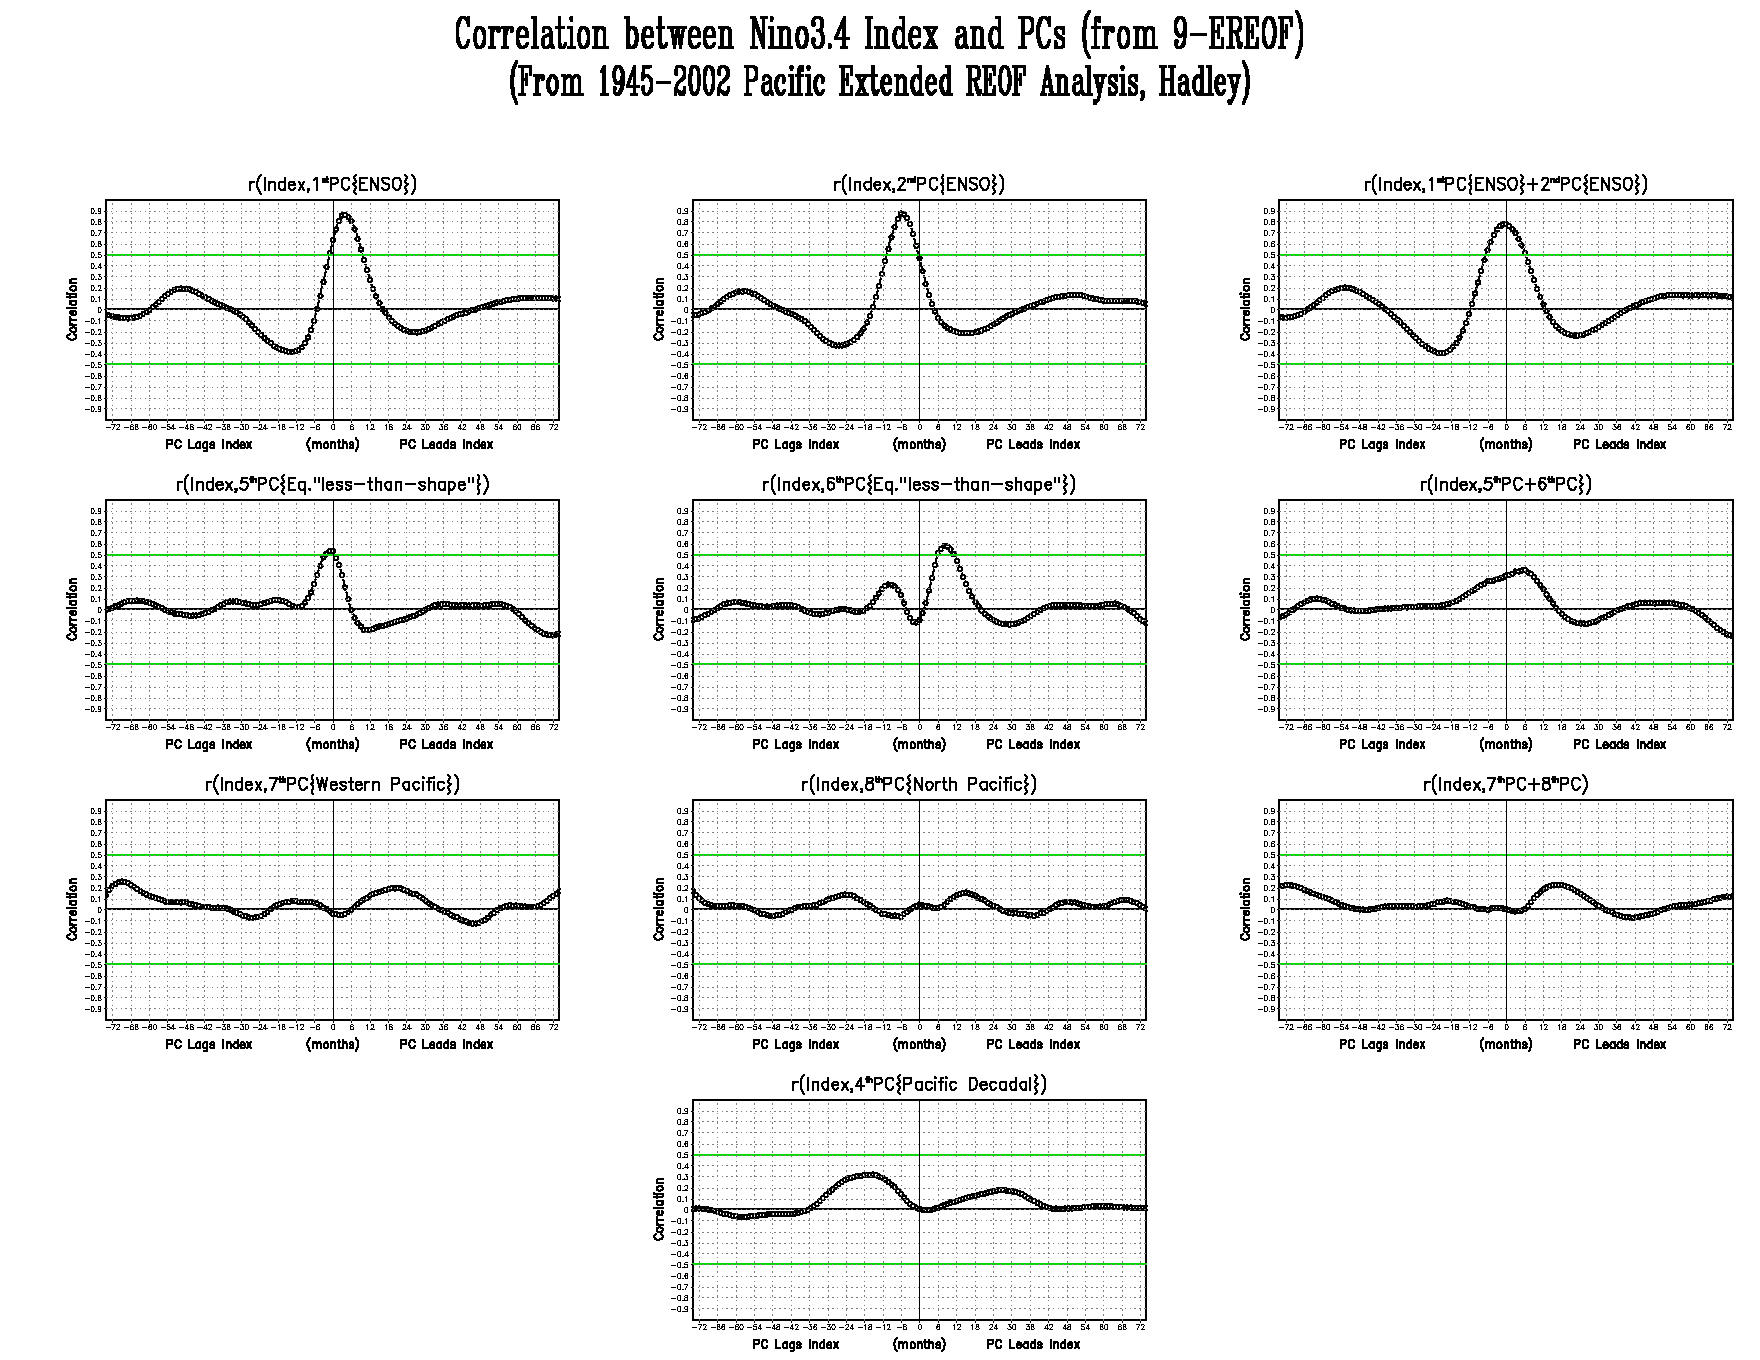
is low (~0.35). Correlations
between NINO3.4 index and PCs of ENSO patterns
are the highest (~0.8), however those with the equatorial "less-than-shape"
patterns are not low neither (0.55-0.6).
This EREOF analysis is done in a
number of ways: 1) for the 1945-2002 period; 2) for the 1900-2002 period;
3) rotating 6 EOFs, 4) for the